Mario Draghi, was that Doing Whatever it Takes?:
Mario Draghi and the European Central Bank rocked markets to the core overnight, with cuts and stimulus that nowhere near met market expectations.
By reducing its deposit rate by only 0.1% to -0.3% (the market wanted -0.4% to -0.5%) and signalling that it would extend its QE stimulus program into March 2017 (the market didn’t even expect a hard date cap) at a current rate of €60 billion a month (again, €75 billion + spoken about), saying expectations were missed is certainly an understatement!
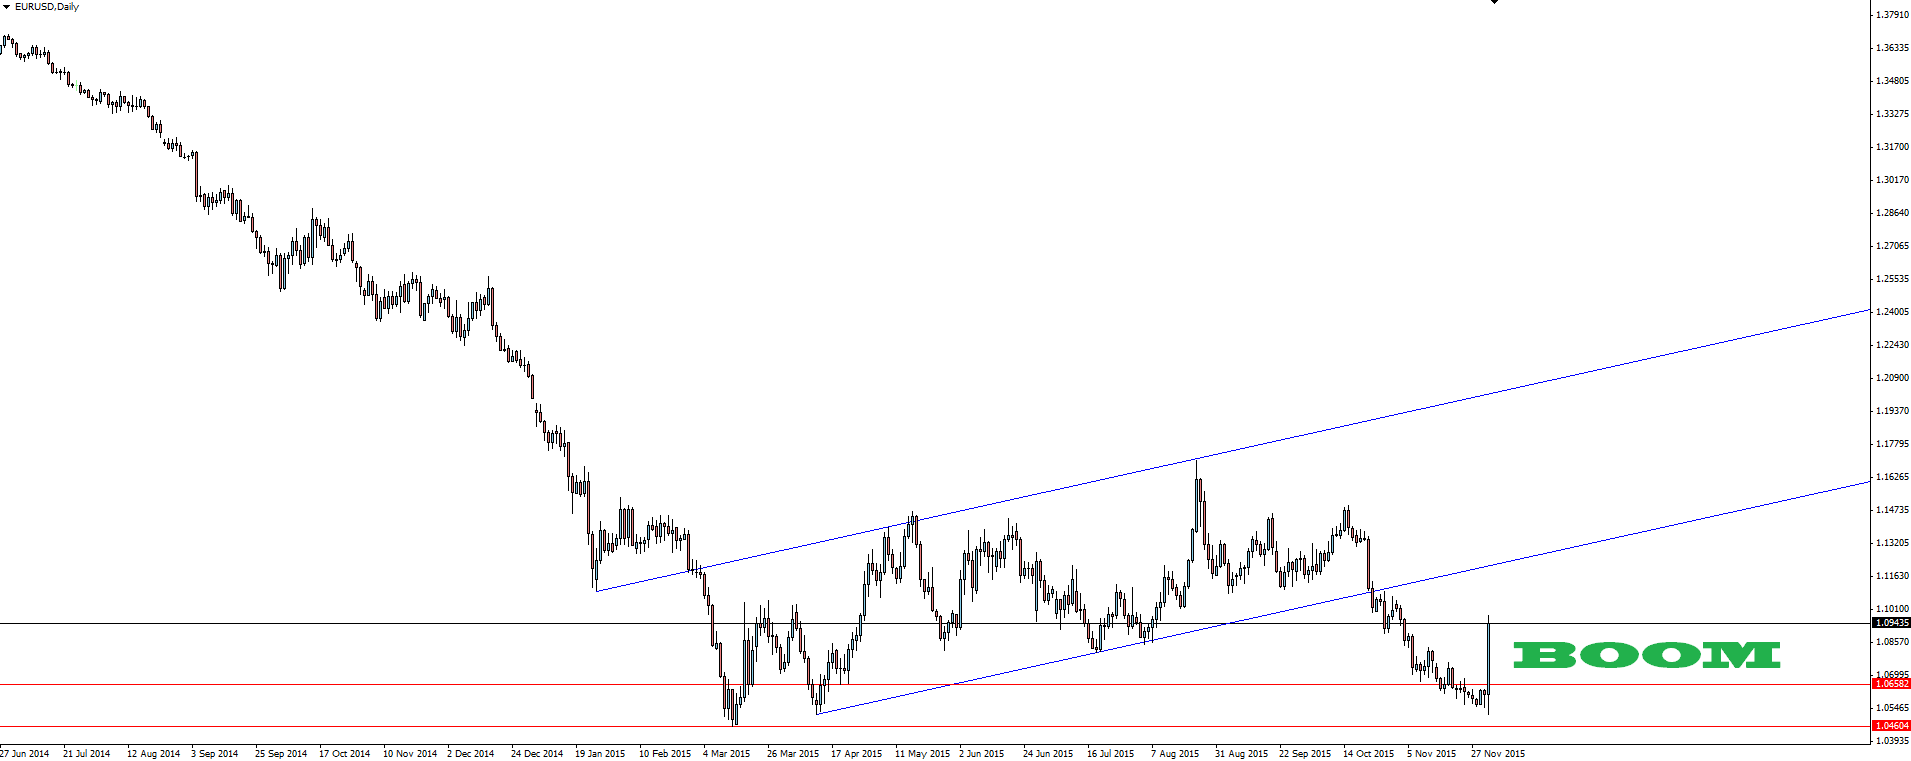
These measures were a far cry from the hard-line ‘whatever it takes‘ type rhetoric that Draghi consistently delivered leading into the meeting and the euro reacted accordingly by experiencing the mother of all short squeezes.
EUR/USD Daily:
Click on chart to see a larger view.
Boom indeed. When expectations are unanimous toward an event and the market is positioned for the one and only possible outcome, it only takes a small miss for a huge re-pricing to occur as the herd scrambles to close positions at any price they can.
Just think, this is the most liquid forex pair and it just rallied almost 500 pips in a single day. That means a huge miscommunication to the market from the ECB and something that in all honesty, just shouldn’t happen.
Where to now for EUR/USD?:
With a still packed USD sensitive economic calendar tonight featuring a hugely anticipated NFP release, lets just say that things may get a lot worse for euro shorts before they get better…
EUR/USD Daily 2:
Click on chart to see a larger view.
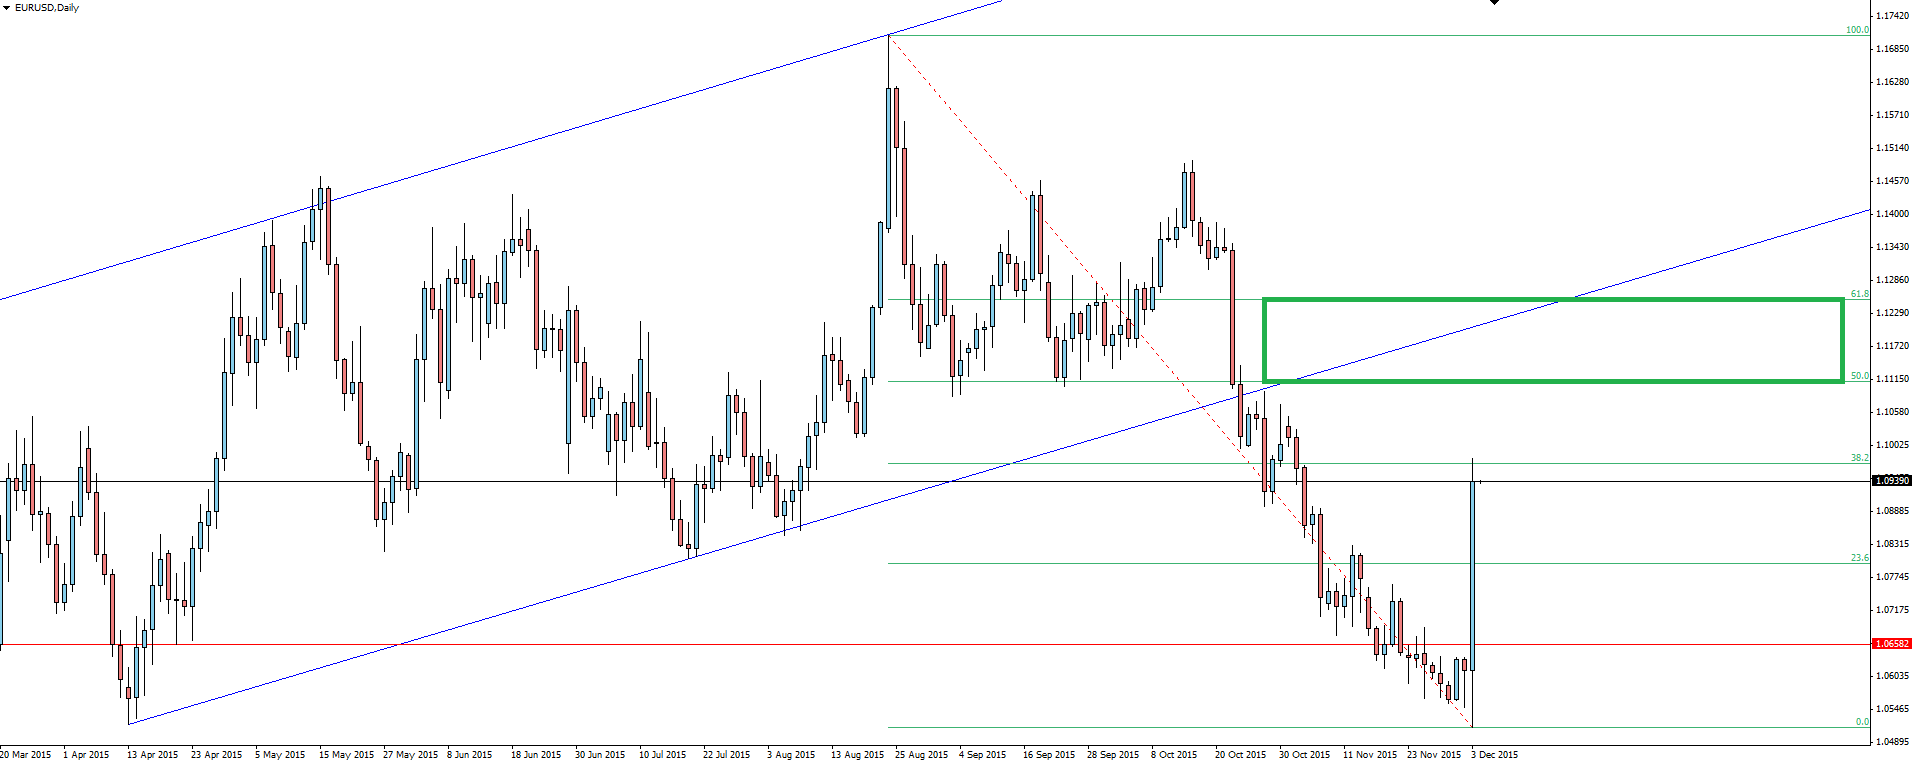
With EUR/USD still really in no-man’s land on the daily chart, I have thrown on the fibs to try and give us some possible areas of logical selling. I have marked the key 50-61.8% zone which also lines up with the underside of our counter trend, flag trend line.
With the market expecting a decent NFP number after this week’s ADP beat, if the US economy doesn’t deliver then an instant shot into that area is a real possibility.
Featured on the Forex Calendar Friday:
AUD Retail Sales m/m
CAD Employment Change
CAD Trade Balance
CAD Unemployment Rate
USD Average Hourly Earnings m/m
USD Non-Farm Employment Change
USD Unemployment Rate
Chart of the Day:
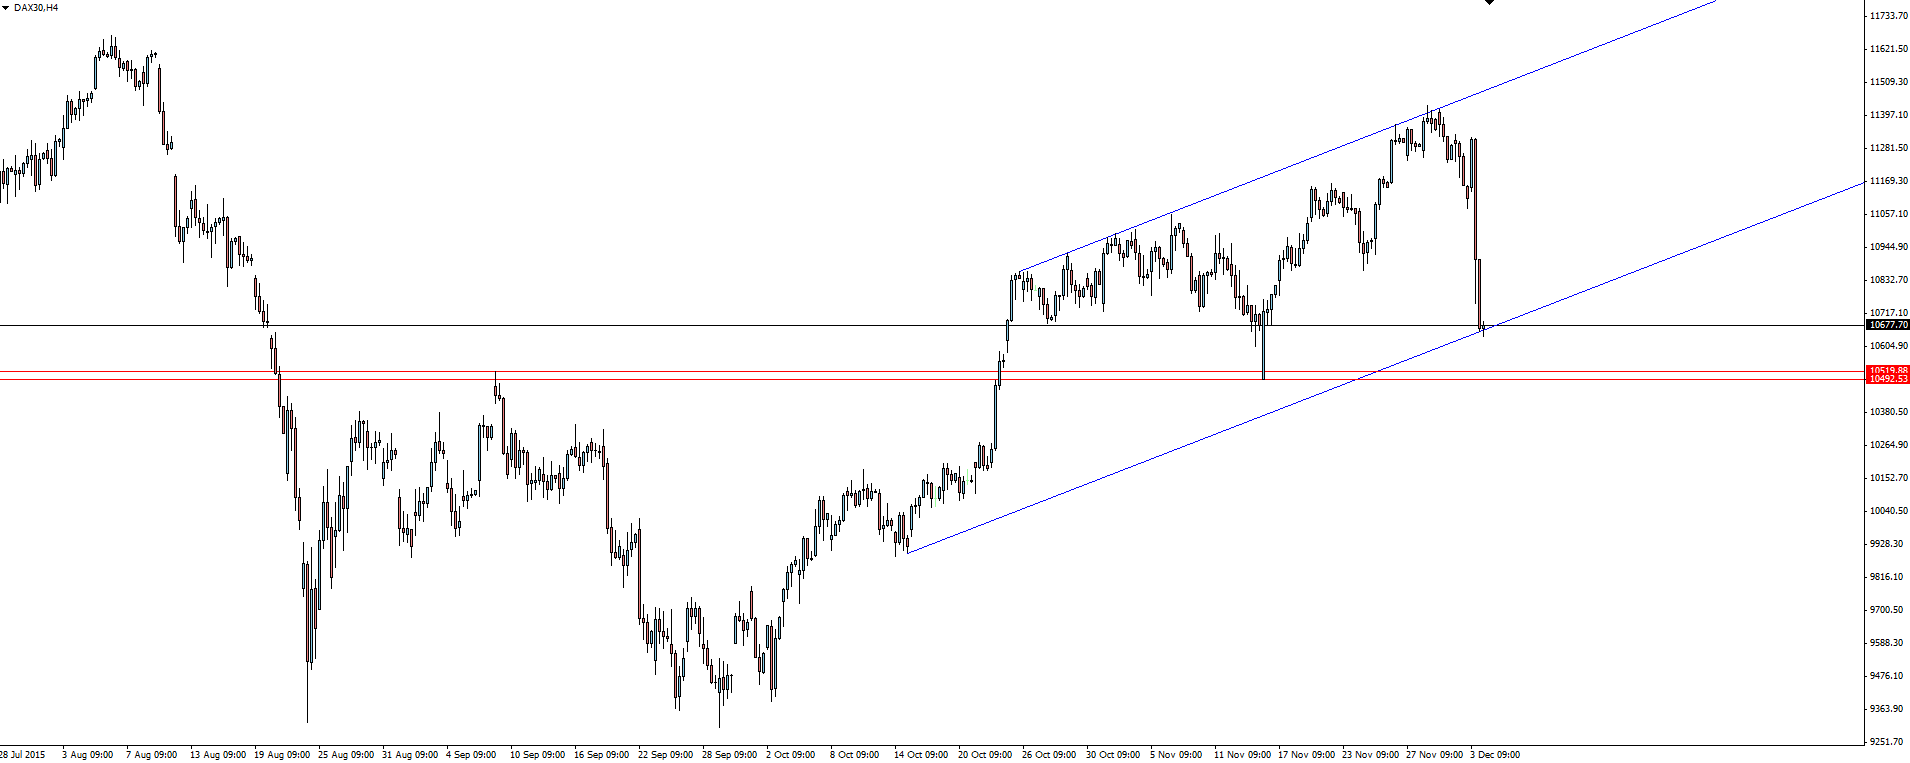
Stock indices traders didn’t escape unscathed either, with the German DAX taking a heavy 3.6% hit.
DAX30 4 Hourly:
Click on chart to see a larger view.
This chart shows just a simple parallel line taken from resistance, drawn from a logical previous swing low to find a potential area of support.
With horizontal resistance still a bit lower, this isn’t a level to be blindly buying off, but it could act as a short term level to determine trading direction off of.
Do you see opportunity in the ECB fallout?
