
When it comes to closed-end funds (or any investment, for that matter), it pays to look for things most people misunderstand. Because these (seemingly) tiny investor oversights and errors can give us keen-eyed contrarians our best buying opportunities.
And when it comes to CEFs, there’s one all-too-common mistake I see folks make time and time again, particularly those who are new to these high-yielding funds. To see what I’m getting at, let’s zero in on a CEF called the Columbia Seligman Premium Technology Growth Closed Fund (NYSE:STK).
STK Romps to a Triple-Digit Return

STK’s portfolio mainly consists of large-cap tech stocks: Apple (NASDAQ:AAPL), chipmaker Broadcom (NASDAQ:AVGO), and Microsoft (NASDAQ:MSFT) are among its top holdings. The fund boasts a dividend just shy of 7% today.
As you can see in the chart above, it’s returned hundreds of percent since its inception nearly 14 years ago. If we average this out to its CAGR (compound annualized growth rate, or simply the average percent return per year), we see that the fund has delivered an incredible 20% per year on average.
Here’s the thing, though—most people have no idea of STK’s incredible performance! Dial it up on a free stock-screening tool like Google Finance and you get this chart, showing a meager 35% return in nearly a decade and a half.

Source: Google Finance
At my CEF Insider service, we don’t use Google Finance or Yahoo Finance because they’re misleading, especially when it comes to CEFs, for a reason I’ll explain in a minute. But most people rely on these free and easy-to-access tools.
Combined, both are more popular than every other financial website by a huge margin. So when users see different results in the charts we use in CEF Insider and those they get from Google and Yahoo, it’s understandable if they’re a bit confused.
So what’s going on here? The simple truth is that Google Finance and Yahoo Finance don’t include dividends when reporting an investment’s historical performance. That’s fine for measuring a non-dividend-paying stock like Alphabet (NASDAQ:GOOGL). But these services don’t work at all for CEFs, which yield 7.9% on average right now.
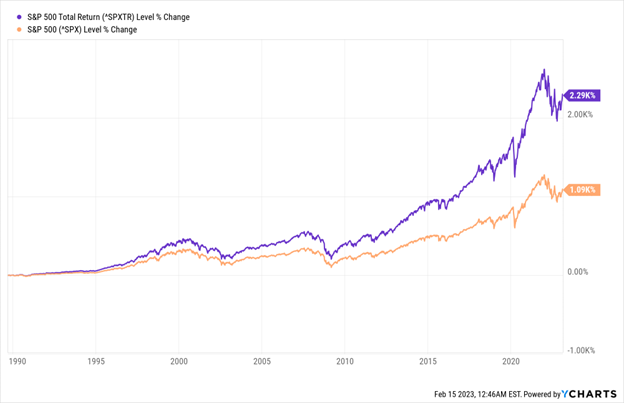
Professional tools like the ones we use at CEF Insider, however, factor in the return you get both from dividends and price gains to give you a fund’s total return. That’s critical because dividends matter a lot—even the comparatively low yield (around 1.5% currently) on the average S&P 500 stock makes a big difference over time.
Price-Only Return and Total Return—Quite the Difference!
So you can imagine that when you’re dealing with a CEF that yields 8% or more, a price-return chart that ignores dividends is very misleading. For example, a fund that traded at $10 a share in 2010 and also at $10 a share in 2020 looks like a dud—unless that same fund has yielded 10% that whole time. In that case, it has delivered a strong 10% yearly profit.
This is why, if you look up STK on most free stock-screening sites, it looks like a disaster. But we know the reality is much different, so we can put this one on our watch list knowing it’s got a history of strong performance going for it.
The key takeaway? When analyzing CEFs, be sure you’re looking at the right charts—and that those charts include dividends in their return calculations. As many of these charts are difficult and expensive for most people to access, your best bet is to let me monitor past performance for you through a subscription to CEF Insider.
Try CEF Insider Risk-Free (and Get Instant Access to the Best 9%+ Dividends)
If you’re thinking of giving CEFs a shot (and I strongly recommend you do, especially if you’d like to retire on dividends alone!), you’re in luck.
Right now, I’m inviting investors to road-test it for 60 days at no risk whatsoever. Stick around for the new picks coming your way in the next two monthly issues, peruse the portfolio (which currently boasts an average yield north of 9%!), and follow the funds that appeal to you.
If you’re not satisfied, no problem. Just let me know during your 60-day trial and you’ll get a full refund. No questions asked.
I’ll also include a Special Report naming 4 of my top CEFs to buy now. Taken together, these 4 funds yield 9.5%. And with the discounts they’re offering, I’m calling for a 20%+ price upside in the next 12 months.
Disclosure: Brett Owens and Michael Foster are contrarian income investors who look for undervalued stocks/funds across the U.S. markets. Click here to learn how to profit from their strategies in the latest report, "7 Great Dividend Growth Stocks for a Secure Retirement."