Following a 37% decline this summer, crude oil has shown signs of recovery.
Since August 24, crude has rallied 19% on declining global rig counts. Many investors believe we’ve seen the bottom, and they’re loading up on energy stocks.
Not so fast!
Crude inventories are approaching maximum capacity, and the International Monetary Fund just downgraded its 2016 outlook on global growth.
We’re certainly closer to oil’s bottom than its top, but a large number of oil companies are overbought on weak fundamentals.
Don’t Fall for the False Signal
The Energy Select Sector SPDR (N:XLE) – the exchange-traded fund that tracks the average movement of the S&P 500 Energy Index – has lagged the S&P 500 for most of the year.
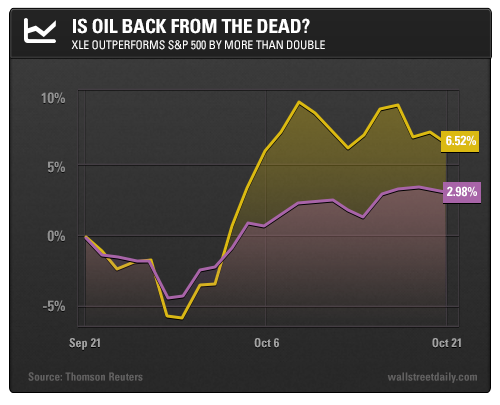
But over the last month, XLE has outperformed the S&P 500 by more than double, as you can see in the following chart.

This outperformance can be attributed to several factors.
First, global rig utilization is down 71% year over year, and production declines have elevated the price of crude oil. Eyeing a bottom, many investors have taken long energy positions.
The resulting rally has forced a large number of hedge funds to close out massive short positions to cover losses. This is known in the financial markets as a short squeeze.
But oil demand has declined even faster than production.
According to a U.S. Energy Information Administration report released on Wednesday, crude inventories rose by 8 million barrels. Analysts, on the other hand, expected an increase of just 3.9 million barrels, according to Reuters.
In short, oil’s momentum is topping out, and now it’s time to get short.
The Short Before the Storm
It’s too early to call the bottom, but there’s little doubt that the short-term rally in oil stocks is unsustainable.
Plus, the long-term downtrend in oil stocks has yet to be broken.
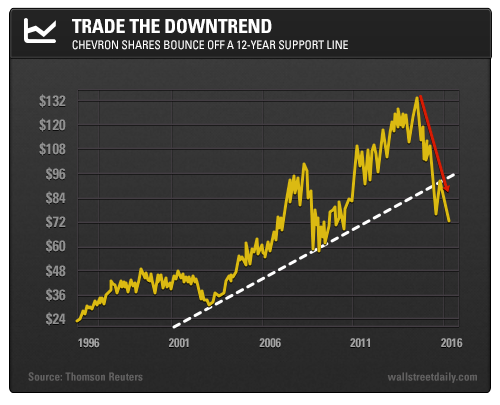
A closer look at the XLE’s constituents reveals Chevron Corp. (N:CVX) as the biggest gainer – as well as the most likely to fall in the near term, based on the company’s relative strength index (RSI).
Chevron’s RSI just crossed below the overbought threshold of 70 from a high of 72 last week. And the stock has met resistance at a 12-year support line – another bearish indicator.

Fundamentally, the company is trading at 25 times earnings – a 41% premium to both its peers and the S&P 500.
This makes Chevron a juicy short-term target for short sellers.
While volatility remains low, options are also a cheap and viable play on shares. Bearish speculators might consider near-dated out-of-money put options to accelerate returns.
Bottom line: oil stocks will recover sooner than later, but not before another big spill. Profit on their downside before you get long.
On the hunt,
