Friday’s reaction to the US employment report was telling, in that the report wasn’t particularly weak (good household survey, non-farm payrolls with revisions beat, etc..), but apparently the market was positioned for a stronger surge in the numbers now that the worst months of US weather related disruptions are behind us. Indeed, US treasuries absolutely ripped higher and yields plunged, just as the five-year yield, for example, was pushing the envelope above the 1.8 percent level late last week. As well, this somewhat risk off response was matched with an awful day for the high-momentum tech stocks in the US on Friday, with the Nasdaq 100 index suffering a large 2.5 percent retreat on the day.
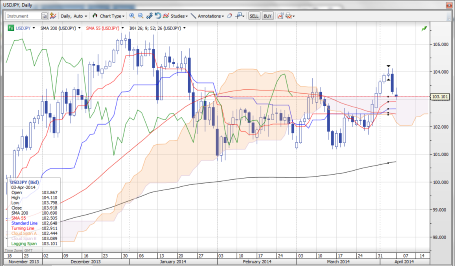
As one might expect under such circumstances, USDJPY pushed back lower after trying to rally in the wake of the data, and this morning finds us at the key support of the Ichimoku daily cloud just above 103.00, a bit of a disappointment after the pair managed to pull to new 2-month highs last week.
Looking ahead
EURCHF mimicked the JPY crosses’ inability to pull through higher as another try through resistance last week was beaten back. Watch the March currency reserves data figures for whether the Ukraine situation put pressure on the Swiss National Bank (SNB) to intervene. Note that Swiss data has seen a number of negative surprises lately and if today’s inflation data points lower and in coming months we may have the SNB rattling its cage sooner rather than later. The other intriguing development I pointed out recently is that the SNB has raised the equity allocation of its reserves, effectively making it at least in part a sovereign wealth fund — and therefore reducing the safe haven credibility of the franc.
We’ll have the Bank of England out on Thursday, likely with no new policy statement as the bank is very much in wait and see mode on the quality and legs of the recovery. The other two data points out of the UK this week of interest are Wednesday’s Trade Balance data and Thursday’s RICS House Price Balance, the best indicator on the direction in UK housing. As I have noted countless times, the UK’s enormous current account shortfall is a significant worry at any time market’s go into risk-off mode.
The US economic calendar is rather quiet this week, with the NFIB Small Business Optimism survey up tomorrow, Federal Open Market Committee minutes on Wednesday and PPI on Friday, as well as the preliminary University of Michigan confidence survey – also on Friday.
In the charts this week I have four levels of interest for the major US crosses:
EURUSD: The 1.3700/50 zone of contention is critical as we get under way this week. The longer we fail to push well below the 1.3700 area, the higher the risk the bears are frustrated once again.
USDJPY: 103.00 support. If we dive deeply through this level, this would put significant pressure on the near-term bearish JPY view. The reaction to Friday’s US employment report and the ugly sell-off in risk on Friday have raised the concern for JPY bears – so let’s see if this important level holds.
Chart: USDJPY

Source: Saxo Bank
AUDUSD: 0.9300+ resistance. This resistance area has remained in place, but the tight consolidation of late suggests that the pair wants to have a try higher. I continue to believe that the days of a Aussie strength are numbered, but let’s see how the pair fares if it pulls above resistance, as we can’t rule out a try at 0.9500 if a break holds. The weekly IMM report (on speculative position in US currency futures) showed that as of last Tuesday, speculators had almost entirely flushed their AUD shorts (minus 4.9k contracts vs. a low earlier this year of -66k contracts and -77k last summer).
USDCAD: 1.1000 and 1.0915. The break below this level on Friday was a bearish development, but I am assuming modes further downside risk and look for strong support to come in soon for the pair – either a pull back through 1.10 or a strong bounce after an attempt through the 1.0915 support.
Economic Data Highlights
- Australia Mar. AiG Performance of Construction Index out at 46.2 vs. 44.2 in Feb.
- Germany Feb. Industrial Production out at +0.4% MoM and +4.8% YoY vs. +0.3%/+4.7% expected, respectively and vs. +4.9% YoY in Jan.
Upcoming Economic Calendar Highlights (all times GMT)
- Switzerland Mar. Foreign Currency Reserves (0700)
- Switzerland Mar. CPI (0715)
- Norway Feb. Industrial Production (0800)
- Euro Zone ECB’s Constancio to Speak before European Parliament (1300)
- US Fed’s Bullard to Speak (1545)
- US Feb. Consumer Credit (1900)
- New Zealand Q1 NZIER Business Opinion Survey (2200)
- Japan Feb. Current Account (2350)
- Australia Mar. NAB Business Conditions/Confidence (0130)
