Get 40% Off
These stocks are up over 10% post earnings. Did you spot the buying opportunity? Our AI did.Read how

Macro-Markets Risk Index Rises After Touching 2014 Low

Published 11/11/2014, 06:17 AM
Updated 07/09/2023, 06:31 AM

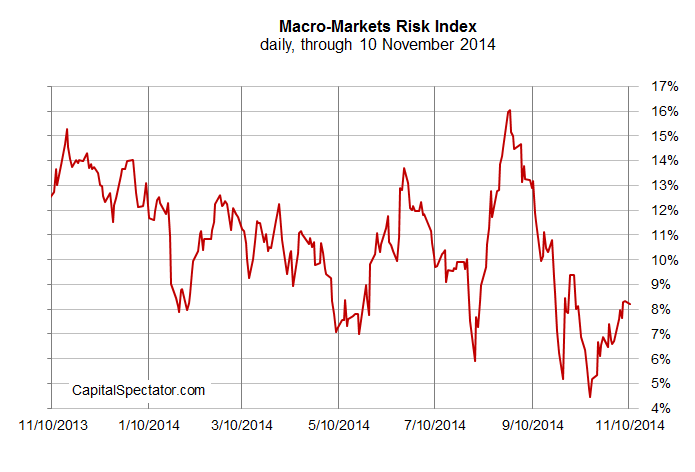
The US economic trend remained positive in early November, rebounding from last month’s decline, according to a markets-based estimate of macro conditions. The Macro-Markets Risk Index (MMRI) closed at +8.2% yesterday (Nov. 10). The index’s revival comes after briefly dipping in mid-October to the lowest level so far in 2014. But even at last month’s trough, MMRI remained positive. The benchmark’s continued run of readings above zero through yesterday suggests that business cycle risk remains low. A decline below 0% in MMRI would indicate that recession risk is elevated. By comparison, readings above 0% imply that the economy will expand in the near-term future.

MMRI represents a subset of the Economic Trend & Momentum indices (ETI and EMI),a pair of benchmarks that track the economy’s broad trend for signs of major turning points in the business cycle via a diversified set of indicators. (For details about ETI and EMI, see Nowcasting The Business Cycle).

Analyzing the market-price components separately offers a real-time approximation of macro conditions, according to the “wisdom of the crowd.” Why look at market data for insight into economic conditions? Timely signals. Conventional economic reports are published with a time lag. MMRI is intended for use as a supplement for developing perspective on the current month’s economic profile until a complete data set is published.

MMRI measures the daily median change of four indicators based on the following calculations:

• US stocks (S&P 500), 250-trading day % change, plotted daily
• Credit spread (BofA ML US High Yield Master II Option-Adjusted Spread), inverted 250-trading day % change, plotted daily
• Treasury yield curve (U.S. 10-Year Treasury yield less U.S. 3-Month T-bill yield), no transformation, plotted daily
• Oil prices (iPath S&P GSCI Crude Oil Total Return Index ETN (NYSE:OIL)), inverted 250-trading day % change, plotted daily

3rd party Ad. Not an offer or recommendation by Investing.com. See disclosure here or remove ads .

Here’s how MMRI compares on a daily basis since August 2007:

Macro Markets Risk Index: Aug. 2007-Nov. 10, 2014

Here’s a closer look at how MMRI compares on a daily basis over the past year:

mmri.a.11nov2014

Latest comments

Risk Disclosure: Trading in financial instruments and/or cryptocurrencies involves high risks including the risk of losing some, or all, of your investment amount, and may not be suitable for all investors. Prices of cryptocurrencies are extremely volatile and may be affected by external factors such as financial, regulatory or political events. Trading on margin increases the financial risks.
Before deciding to trade in financial instrument or cryptocurrencies you should be fully informed of the risks and costs associated with trading the financial markets, carefully consider your investment objectives, level of experience, and risk appetite, and seek professional advice where needed.
Fusion Media would like to remind you that the data contained in this website is not necessarily real-time nor accurate. The data and prices on the website are not necessarily provided by any market or exchange, but may be provided by market makers, and so prices may not be accurate and may differ from the actual price at any given market, meaning prices are indicative and not appropriate for trading purposes. Fusion Media and any provider of the data contained in this website will not accept liability for any loss or damage as a result of your trading, or your reliance on the information contained within this website.
It is prohibited to use, store, reproduce, display, modify, transmit or distribute the data contained in this website without the explicit prior written permission of Fusion Media and/or the data provider. All intellectual property rights are reserved by the providers and/or the exchange providing the data contained in this website.
Fusion Media may be compensated by the advertisers that appear on the website, based on your interaction with the advertisements or advertisers.
© 2007-2024 - Fusion Media Limited. All Rights Reserved.