
Lowe's Companies Inc (NYSE:LOW) was able to outperform the S&P 500 Index in 2018 when the U.S. major index closed in negative territory. The stock finished the year yielding slight positive capital gain 1% and about 2% dividend, while the S&P 500 index lost about 6.8%.
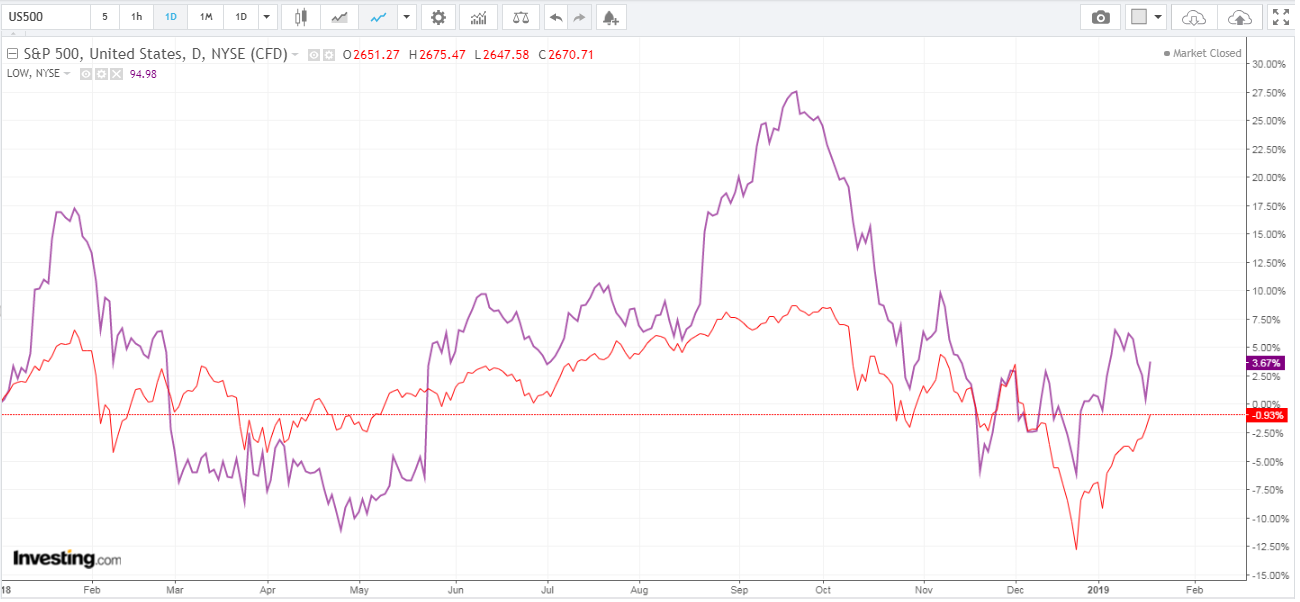
Source: Investing.com
The stable housing market, increasing house prices and quite a high level of consumer confidence are good tailwinds for the business. Despite a little slowdown in U.S. existing home sales in 2018, now the situation is stabilizing, by the way, it is far higher than its long-term averages.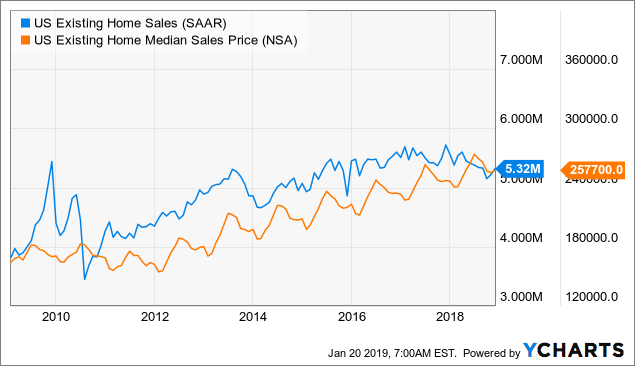
U.S. Existing Home Sales data by YCharts
Company Overview
The company is the second largest home improvement retailer in the world with $69 billion annual sales. The huge scale of the company gives the firem great purchasing power, due to which the company suggests low prices and creates a considerable economic moat for the business.
The new CEO Marvin Elison is triggering structural changes in the company. Emphasizing the importance of supply chain improvements and the usage of new technology, the management is going to spend $1.6 billion in capital expenditures in 2019. They are going to improve the quality of the labor management and inventory control which would undeniably cut spendings and improve profitability ratios.
Competitive Advantages
The company's scale gives the firm a great bargaining power with suppliers when it comes to products and advertisement. The company’s strategy has helped it deliver average adjusted returns on invested capital of 16% over the past five years, at the same time the management's long-term goal for ROIC is 35% which is quite realistic considering that in 2009 the ROIC was just 9.36% and in 2018 it was 17.04.
The developed distribution network is one of the firm's competitive advantages. The company's supply chain connects 80% of the firm's merchandise through one of 15 regional distribution centers. The management invests heavily on expanding the supply chain: the bulk distribution network will expand to more than 20 locations from 11 in 2018, and cross-dock delivery terminals will be 90 from 5 currently.
The firm intends to capture 12% long-term operating margin. We need to notice that the trend favors the projection as the company was able to increase the margin steadily in the last 10-year period (from 6.9% in 2010 to 9.6% in 2018).
First of all, we compare the stock price with the analyst's consensus price target. We notice here that in the last 5-year period the stock was mainly undervalued compared to analyst's estimates, and now it stands 15% lower than the average price target.
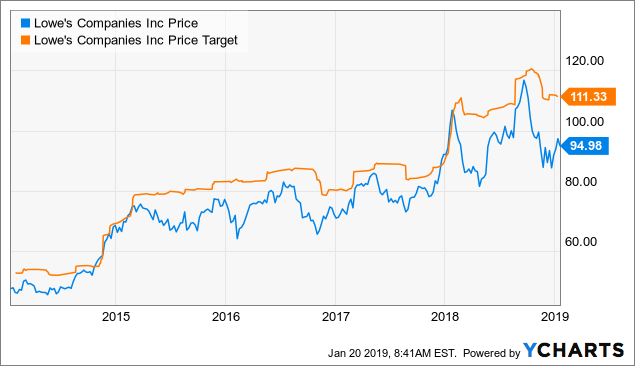
LOW data by YChartsDCF
Valuation
Lowe's was able to generate 3.97% CAGR of revenue in the last 10-year period. At the same time in 2018, the firm generated a 4% sales growth rate with same-store sales growth of 2.5% and moderate location growth (netting 10 boxes per year). If we consider the above-mentioned tailwinds and growth rate in past years, the 3% revenue growth rate will be quite a controversial projection for the future 10 years.
The operating margin was steadily increasing in the past years reaching 9.6% level. Considering management's cost-cutting strategy and investments in the development of the supply chain we think that the margins could continue their upward movement. The management's long-term operating margin target is 12%. Despite the fact that we consider the target quite realistic, in our model, we will use 9.6%-10% territory considering that the margin will slowly expand to 10%.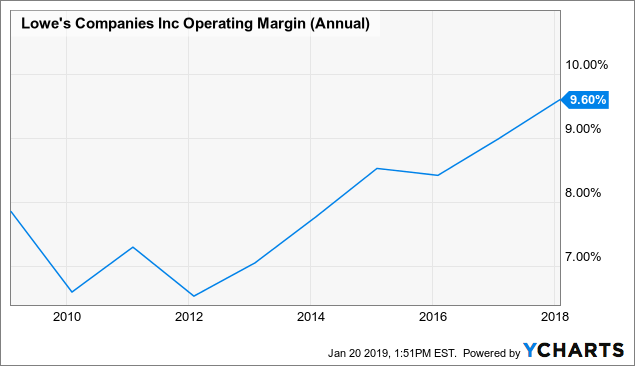
LOW Operating Margin (Annual) data by YCharts
WACC
To calculate the WACC we take 10-year T-Note bond yield, 5.21% equity risk premium and 36-month rolling beta of 1.05. The result is 7.28%.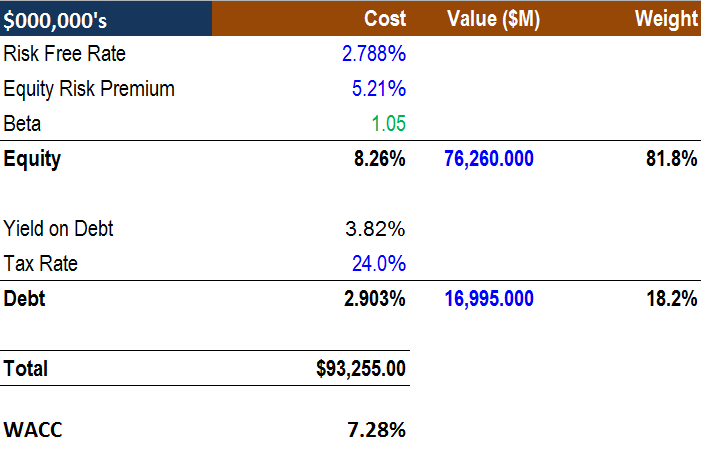
Source: Author's spreadsheet
Last but not least, to calculate the terminal value we will use 3-year median EV/EBITDA ratio which is equal to 11.59.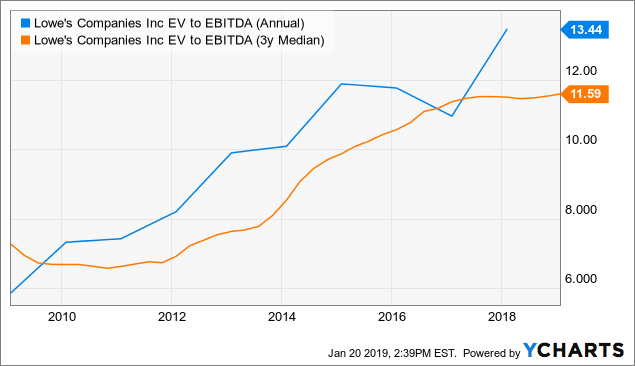
LOW EV to EBITDA (Annual) data by YCharts
Our final model is here. We have $115 intrinsic value which exceeds current market price by 21%. We need to notice that we recorded about 20% undervaluation when we adopted a pretty controversial approach, with only 3% revenue growth and no more than 10% operating margin.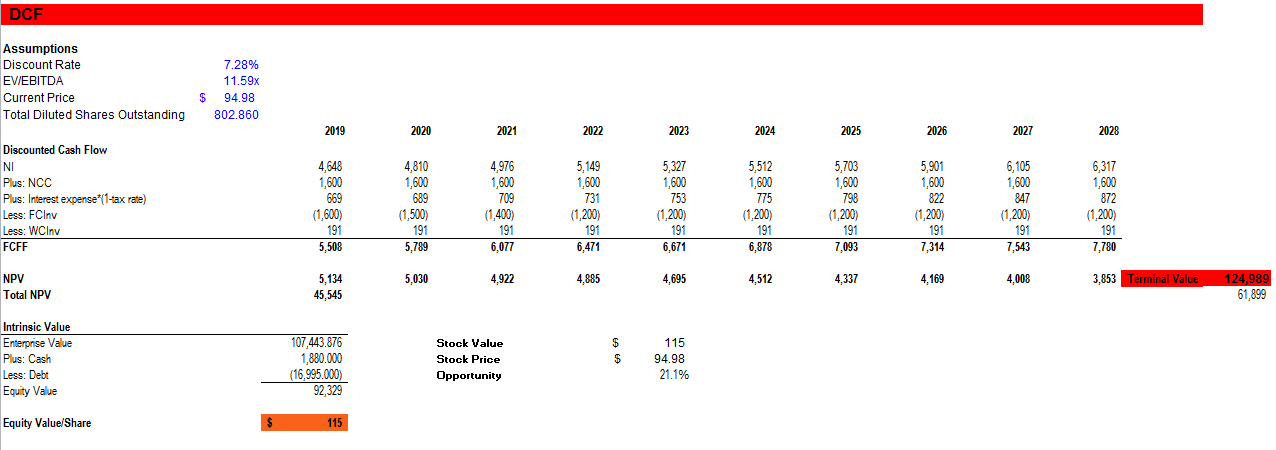
Source: Author's spreadsheet
At the same time, the Company has a share repurchase program that is executed through purchases made from time to time either in the open market or through private off-market transactions. On January 26, 2018, the Company’s Board of Directors authorized a $5.0 billion share repurchase program with no expiration, which was announced on the same day. As of November 2, 2018, the Company had $4.5 billion remaining in its share repurchase program.
It means that the outstanding stock quantity is rapidly shrinking. If they buy the stocks at current market price, it would mean that 5.5% of total shares outstanding would go out from the market increasing the EPS and stock prices.
Conclusion
The company looks attractively valued in the current market condition, the macroenvironment and management's efforts to improve the company's efficiency provide great tailwinds for the firm. Our price target of $115 approximately coincides with analysts' consensus price target.