Who knows whether this near-term trend will amount to anything, but it seems worth pointing out that copper and basic materials are still not on board the current risk rally despite monster gains in recent months as the banks, energy and small cap are consolidating between lower highs and higher lows in what appear to be topping patterns.
Starting out with copper, until it closes above its all-important third Bull Fan Line at about $3.93/lb, if should do so at all, it remains in the grips of an intermediate-term downtrend and clear sets of lower highs in both the near- and intermediate-term and this may suggest copper will give way to an unmarked Rounding Top with a target of $3.35/lb.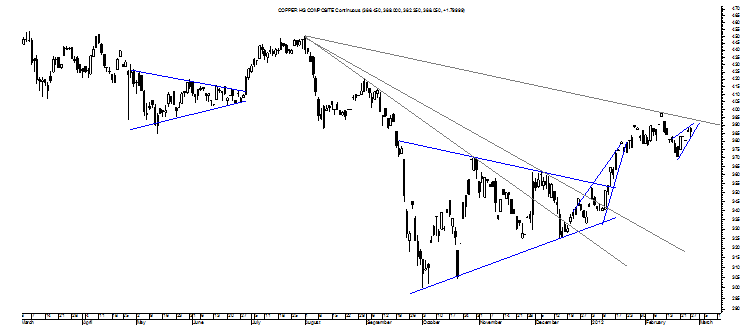
Not surprisingly, the basic materials sector has not closed above its third Bull Fan Line either while showing a strong set of lower highs in the near-term on declining volume and all of this suggests that the XLB may drop to at least $35 to close a gap at that level.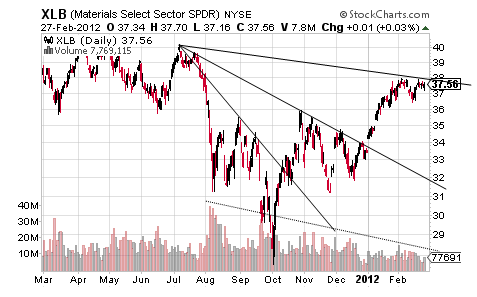
Turning to the XLF, its recent lower highs is subtle and appears to forming a Symmetrical Triangle of sorts with a set of higher lows.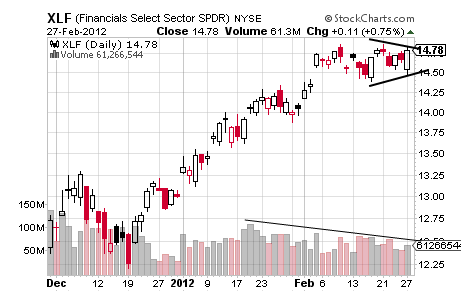
This pattern presents bearishly right now, but let’s look at both sides and it confirms to the upside at $14.87 for a target of $15.35 while it confirms to the downside at $14.41 for a target of $13.91 and perhaps this side is supported by the XLF’s declining volume.
Taking a real near-term look at the energy sector, the XLE’s 15-minute 5-day chart appears to be showing a Symmetrical Triangle of its own that may be sporting a Double Top that would come close to confirming the Symmetrical Triangle to the downside.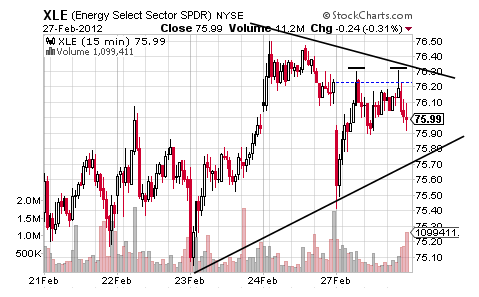
Talking targets, the XLE’s intraday Double Top confirms at $75.90 for a target of $75.50 that would basically confirm that Symmetrical Triangle for its downside target of about $74.50 and a possibility that might hurt its daily chart more than its $77.50 upside target would help it.
Lastly, turning to the Russell 2000, its platform of sideways trading is comprised of slightly lower highs as of late and slightly higher lows to create consolidation that is going to spring from its nearly undetectable coil soon.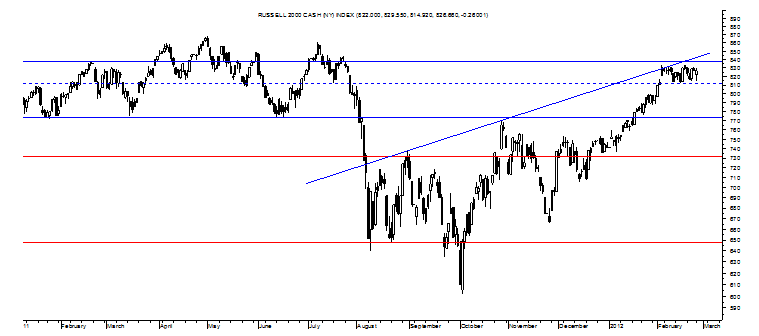
If up, it confirms at 833 for a target of 854 and if down, it confirms at 812 for a target of 791 with that balking below the official neckline of that Inverse Head and Shoulders perhaps supporting the downside while its hold of critical support in recent days may support the upside.
When one final chart is brought into the picture, though, and no, it’s not the VIX even though its Bull Pennant and IHS with targets of 20.63 and 30.00, respectively, support the risk-off implications of a small Double Top in the 10-year yield.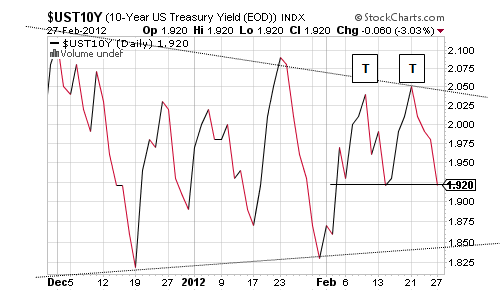
It, too, is showing the consolidation of lower highs and higher lows as was discussed last week, but more immediately, the 10-year’s almost-confirmed Double Top carries a target of 1.79% and a level that would confirm its Symmetrical Triangle for its 1.00% target, rather than its 3.00% target, and something that would signal a round of risk off most likely.
In turn, it makes sense to at least note that there are lots of lower highs out there.
- English (UK)
- English (India)
- English (Canada)
- English (Australia)
- English (South Africa)
- English (Philippines)
- English (Nigeria)
- Deutsch
- Español (España)
- Español (México)
- Français
- Italiano
- Nederlands
- Português (Portugal)
- Polski
- Português (Brasil)
- Русский
- Türkçe
- العربية
- Ελληνικά
- Svenska
- Suomi
- עברית
- 日本語
- 한국어
- 简体中文
- 繁體中文
- Bahasa Indonesia
- Bahasa Melayu
- ไทย
- Tiếng Việt
- हिंदी
Lots of Lower Highs Out There
Published 02/28/2012, 04:16 AM
Updated 07/09/2023, 06:31 AM
Lots of Lower Highs Out There
Latest comments
Loading next article…
Install Our App
Risk Disclosure: Trading in financial instruments and/or cryptocurrencies involves high risks including the risk of losing some, or all, of your investment amount, and may not be suitable for all investors. Prices of cryptocurrencies are extremely volatile and may be affected by external factors such as financial, regulatory or political events. Trading on margin increases the financial risks.
Before deciding to trade in financial instrument or cryptocurrencies you should be fully informed of the risks and costs associated with trading the financial markets, carefully consider your investment objectives, level of experience, and risk appetite, and seek professional advice where needed.
Fusion Media would like to remind you that the data contained in this website is not necessarily real-time nor accurate. The data and prices on the website are not necessarily provided by any market or exchange, but may be provided by market makers, and so prices may not be accurate and may differ from the actual price at any given market, meaning prices are indicative and not appropriate for trading purposes. Fusion Media and any provider of the data contained in this website will not accept liability for any loss or damage as a result of your trading, or your reliance on the information contained within this website.
It is prohibited to use, store, reproduce, display, modify, transmit or distribute the data contained in this website without the explicit prior written permission of Fusion Media and/or the data provider. All intellectual property rights are reserved by the providers and/or the exchange providing the data contained in this website.
Fusion Media may be compensated by the advertisers that appear on the website, based on your interaction with the advertisements or advertisers.
© 2007-2024 - Fusion Media Limited. All Rights Reserved.
