Get 40% Off
👀 👁 🧿 All eyes on Biogen, up +4,56% after posting earnings. Our AI picked it in March 2024.
Which stocks will surge next?
Unlock AI-picked Stocks

ETF Losses Weighed On Markets Last Week

Published 08/29/2016, 07:30 AM
Updated 07/09/2023, 06:31 AM

Investment gains were missing in action last week for all the major asset classes, based on a set of broadly defined proxy ETFs. The best performer only managed to hold steady for the five trading days through Aug. 28, with the rest of the field posting varying degrees of loss.

SPDR Barclays (LON:BARC) High Yield Bond (NYSE:JNK) remained unchanged last week, posting a zero total return–the best performance for the last full week of August. Flatlining looks pretty good vs. the worst performer for the previous week: emerging-market stocks tumbled 2.3% via Vanguard FTSE Emerging Markets (NYSE:VWO). The slide in VWO—the first weekly decline for the fund since early July—was due in part to higher probability estimates for a US rate hike in the near term after moderately hawkish comments from Fed officials last week. Emerging-market assets are widely viewed as vulnerable in periods of rising US rates, which tends to lift the US dollar and create headwinds for so-called developing countries.

The negative tone in last week’s trading took a toll on an ETF-based version of the Global Markets Index (GMI.F), an investable, unmanaged benchmark that holds all the major asset classes in market-value weights. GMI.F slipped 0.7%, the first weekly loss for the benchmark in three weeks.
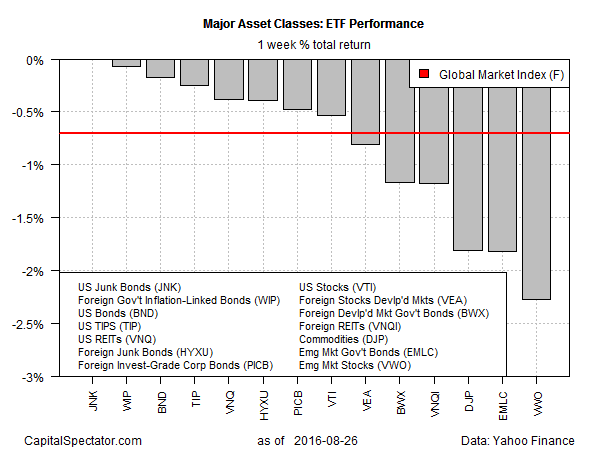
ETF Performance

For the trailing one-year results, US real estate investment trusts (REITs) continue to hold the top position. Although Vanguard REIT (NYSE:VNQ) fell last week, the ETF is still in the lead for the major asset classes over the past 12 months with a strong 23.8% total return through Friday.

3rd party Ad. Not an offer or recommendation by Investing.com. See disclosure here or remove ads .

Meantime, broadly defined commodities remain dead last in the one-year return column. The iPath Bloomberg Commodity (NYSE:DJP) is off 4.3% for the 252 trading days through Aug. 28.

GMI.F, by contrast, continues to hold on to a respectable gain for one-year results. As of last Friday, the benchmark’s total return is a solid 7.4% for the past 12 months.
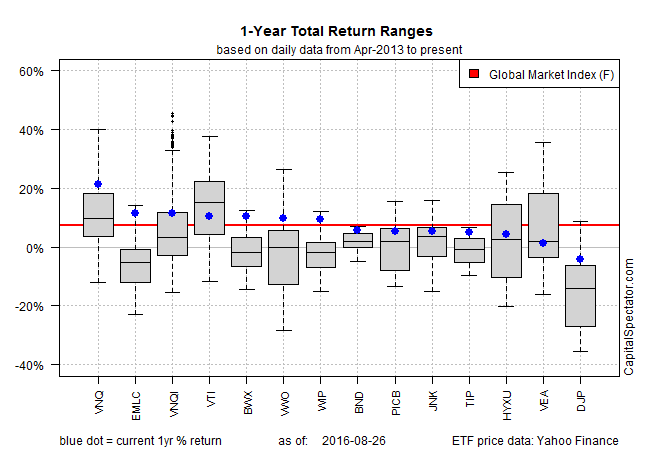
1-Year Returns

Latest comments

Risk Disclosure: Trading in financial instruments and/or cryptocurrencies involves high risks including the risk of losing some, or all, of your investment amount, and may not be suitable for all investors. Prices of cryptocurrencies are extremely volatile and may be affected by external factors such as financial, regulatory or political events. Trading on margin increases the financial risks.
Before deciding to trade in financial instrument or cryptocurrencies you should be fully informed of the risks and costs associated with trading the financial markets, carefully consider your investment objectives, level of experience, and risk appetite, and seek professional advice where needed.
Fusion Media would like to remind you that the data contained in this website is not necessarily real-time nor accurate. The data and prices on the website are not necessarily provided by any market or exchange, but may be provided by market makers, and so prices may not be accurate and may differ from the actual price at any given market, meaning prices are indicative and not appropriate for trading purposes. Fusion Media and any provider of the data contained in this website will not accept liability for any loss or damage as a result of your trading, or your reliance on the information contained within this website.
It is prohibited to use, store, reproduce, display, modify, transmit or distribute the data contained in this website without the explicit prior written permission of Fusion Media and/or the data provider. All intellectual property rights are reserved by the providers and/or the exchange providing the data contained in this website.
Fusion Media may be compensated by the advertisers that appear on the website, based on your interaction with the advertisements or advertisers.
© 2007-2024 - Fusion Media Limited. All Rights Reserved.