
T2108 Status: 14.9%
T2107 Status: 16.4%
VIX Status: 27.0 (an elevated close last seen September, 2015)
General (Short-term) Trading Call: bullish with a “short leash”
Active T2108 periods: Day #2 under 20%, Day #5 under 30%, Day #21 under 40%, Day #25 below 50%, Day #40 under 60%, Day #381 under 70%
Commentary
Between the shutdown of China’s stock market circuit breakers on Friday and the U.S. jobs report, the market somehow found some relief. The relief lasted for about the first 5 minutes of U.S. trading.

The S&P 500 (SPDR S&P 500 (N:SPY)) closes below its lower-Bollinger® Band (BB) for the 2nd straight day. The index has dipped below this 2-standard deviation level 4 of the last 5 trading days.

The S&P 500 (SPY) opened green to start the trading day, but everything fell apart after 5 minutes.
The selling drove T2108, the percentage of stocks trading above their respective 40-day moving averages (DMAs), to a new 3+ closing low at 14.9%. This is the second day of the oversold period (T2108
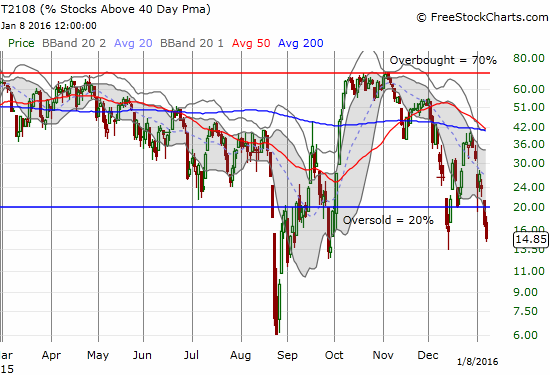
T2108 dives deeper into oversold territory

T2107 approaches an important test of support. A break could signal a brand new form of bearish pressure on the stock market.
With oversold conditions stretching, I am surprised the VIX, the volatility index, is not even higher than it is. Instead, the VIX closed on Friday just below the 2012 intraday high. Could the VIX fail exactly where the last oversold period in December failed?

The VIX faces its own critical test with the important intraday high from 2012 looming overhead.
The oversold period is now deep enough for me to get a lot more bullish: I moved my trading call from bullish with a very short leash to bullish with just a short leash. Given the quickly deteriorating technicals of the S&P 500, I am guessing a first upside target at the first lower-Bollinger Band (BB) makes sense. However, T2108 may not even exit oversold territory at that point, so my most optimistic target for now is the rapidly declining 20DMA.
In-line with my trading call, I released more short positions. This is where things get VERY uncomfortable for me and my positioning. One bearish position I sold was omy put options on Tesla Motors (O:TSLA). This turned into a 2-day holding; I figured time would quickly work against me with a week to go before expiration. Ironically, even as I closed it out near the close, the move TSLA printed is a confirmation of the earlier 50DMA breakdown from 50DMA support. TSLA traversed the entire lower-Bollinger Band (BB) channel in a bearish engulfing pattern. This is a pattern where initial buying breaks the previous day’s high in what looks like a positive turn-around only to quickly give way to a hasty retreat and close even below the previous day’s low.

Tesla Motors (TSLA) is struggling again. Can the October and November lows hold as support?
On the bullish side, I did not add to my holdings of call options on ProShares Ultra S&P500 (N:SSO). I am definitely targeting call options AND shares if the oversold period goes any deeper this week. I DID add to my bets against volatility. I bought put options on ProShares Ultra VIX Short-Term Futures (N:UVXY) and more shares of ProShares Short VIX Short-Term Futures (N:SVXY).

ProShares Short VIX Short-Term Futures (SVXY) has not been this low since the summer of 2013.. This anti-volatility bet is definitely losing its mojo.
This is also a time to scout out strong buying opportunities – stocks that might lead the charge out of oversold trading conditions. I found an interesting candidate in Children’s Place (O:PLCE). Traders loaded up on put options ahead of the company’s latest guidance. That guidance turned out to be good enough for a strong and bullish 200DMA breakout. This is an impressive move during oversold trading conditions where T2107 is tanking. The pullback on Friday looks a small window to participate at a slightly lower price.

Bullish relative strength: Children’s Place (PLCE) is breaking out just as stocks everywhere else are breaking down.
On the other hand, I sold my long-term call option on Wal-Mart Stores (N:WMT). As I discussed earlier, I only planned to hold onto my fortuitous profits another day if some news came out to explain the recent run-up. None was forthcoming. I was fortunate to sell right at the open.
Finally, the currency markets are relatively quiet in overnight trading ahead of Monday’s open. The Australian dollar (Guggenheim CurrencyShares Australian Dollar (N:FXA)) versus the Japanese yen (Guggenheim CurrencyShares Japanese Yen (N:FXY)) is trying again to print a bottom. If this holds into the U.S. open, it could start the launching pad for the highly anticipated oversold bounce.

Classic “panic” right after currency markets open for the week gives way to a relief bounce…
The U.S. dollar index (DXY) ended the day with little gain. The index initially rallied all the way to the previous day’s high. The small net gain is consistent with a market that barely bumped up the odds of rate hikes in the wake of the U.S. jobs report.
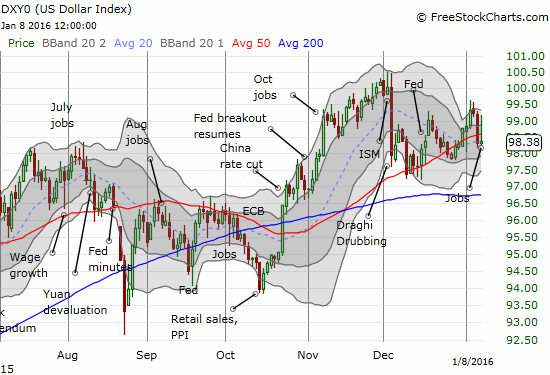
The U.S. dollar fails to hold onto initial gains. The 50DMA is looking more and more like a pivot point.
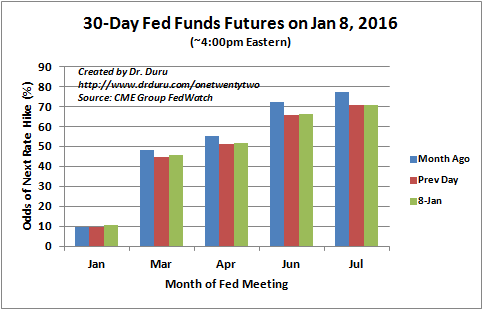
The market is still barely clinging to an April trigger for the next rate hike.
Daily T2108 vs the S&P 500")
Black line: T2108 (measured on the right); Green line: S&P 500 (for comparative purposes)
Red line: T2108 Overbought (70%); Blue line: T2108 Oversold (20%)
Weekly T2108
Be careful out there!
Full disclosure: long SVXY shares, long UVXY put options, long SSO call options, net long the U.S. dollar, net short the Australian dollar, long and short various currencies versus the Japanese yen