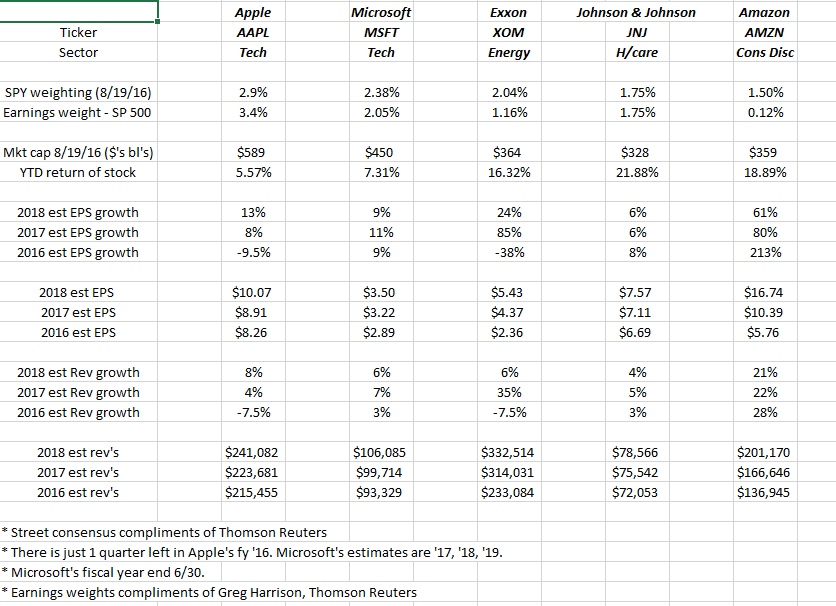
This weekend, some time was spent looking at how the top 5 stocks in the SP 500 (NYSE:SPY) looked from an earnings and revenue growth perspective. (See above table – market data as of Friday, August 19, and earnings and revenue data as of the weekend.)
Readers that have a bearish tilt or have a penchant to want to short the market, constantly voice skepticism around SP 500 earnings growth after four consecutive quarters of negative earnings growth and barely positive revenue growth, and I agree except that, outside of two sectors, which now have bottomed (or looked to have bottomed) the SP 500 remains in decent shape.
1.) Amazon (NASDAQ:AMZN) is the 5th largest market cap weighting in the SP 500 even though its market cap is larger than that of JNJ – that was surprising. In other words, given AMZN’s market cap, the stock should be the 4th largest weighting in the SPY.
2.) The top 5 stocks in the index all had outperformed the SP 500 YTD as of August 19th, with the exception of Apple (NASDAQ:AAPL) and even that stock was close to the SP 500’s +6% to +7% return YTD.
3.) Ex-Amazon, the “average” expected, EPS growth for 2016 for the other 4 stocks is -7.6%, versus the SP 500’s expected ‘flat” earnings growth in 2016.
4.) Ex-Amazon. the “average” expected, revenue growth for 2016 for the other 4 stocks is -2.3%, versus the SP 500’s expected flat to slightly positive revenue growth for 2016.
5.) Ex-Exxon (NYSE:XOM) if we excluded XOM’s 2016 data, the top three stocks would “average” 7.5% EPS growth and -2% revenue growth. Excluding XOM, 2017 “expected” EPS and revenue growth is 9% and 5% for the other 3 stocks, and these numbers look far better if Amazon is included.
5.) The sum of all 5 stocks have an approximate $2 trillion market cap at present. If we assume the total market cap of the SP 500 is roughly $17 trillion, then these top 5 stocks represent 12% of the SP 500’s total market cap.
Conclusion: With Amazon part of the Consumer Discretionary sector, the top 5 stocks in the SP 500 represent Technology, Energy, Health Care and Consumer Discretionary, even though with Amazon Web Services (AWS), you could make a good case that Amazon belongs in the Tech sector.
Apple and Microsoft (NASDAQ:MSFT) are over $1 trillion in market cap by themselves, or roughly 6% of the total SP 500.
As has been written on this blog many times in the past, the influence of Energy on the SP 500 is significant. Just look at Exxon’s (XOM) numbers: if we excluded XOM’s 2016 data, the top three stocks would “average 7.5% EPS growth and -2% revenue growth. Excluding XOM, 2017 “expected” EPS and revenue growth is 9% and 5% for the other 3 stocks, and these numbers look far better if Amazon is included.
To be frank, I drew a different conclusion after posting the data than what was my expectation coming into the article. Exxon-Mobil’s stock never really reflected the sharp deterioration in EPS and revenue growth from “peak” earnings to today’s EPS expectation. At it’s peak in 2012 and 2013, XOM earned about $8.50 per share, in 2016 Exxon (NYSE:XOM) will earn $2.50 per share (roughly) and yet the stock peaked at $105 and it trading at $88, so earnings fell 75% and the stock price fell 15% from their respective peaks.
What explains that disconnect ? Liquidity ? The dividend yield of 3.5% that is safer relative to the rest of the sector, etc ? Has Exxon already discounted a crude oil recovery ?
Market cap does matter. Stock selection matters even more.
Excluding market cap, if we were to sort the SP 500 by “earnings weight” the top 5 stocks in the index, here is what we’d have:
| Ticker | /Earnings/Weight |
| AAPL | 3.41% |
| MSFT | 2.05% |
| JPM | 1.91% |
| WFC | 1.81% |
| T | 1.76% |
Source: Thomson Reuters
The top-5 stocks in terms of earnings weight represent about 12% of the SP 500 market cap and 10% of its earnings weight. (Seeing AT&T (NYSE:T) in the top 5 in terms of earnings weight was a surprise.)
This must be pointed out to readers that given the numbers, 2017 looks very healthy, particularly for Energy.
The negative sentiment around the markets continues to amaze me, and leave me feeling optimistic around “expected returns” for the SP 500 for the next 18 months.
Long AAPL, MSFT, XOM (mostly XLE (NYSE:XLE), IYE), small position on JNJ and AMZN.
