
Lindsay Corporation (NYSE:LNN) delivered adjusted net earnings of 50 cents per share in the third quarter of fiscal 2019 (ended May 31, 2019) compared to the earnings per share of $1.66 recorded in the year-ago quarter. Earnings significantly lagged the Zacks Consensus Estimate of 81 cents. Lower commodity prices and trade uncertainty weighed on irrigation equipment demand during the reported quarter. Also, strong Road Zipper System sales in the year-ago quarter led to the challenging year-over-year comparison.
Including the after-tax costs related to the company’s Foundation for Growth initiative, net earnings for the quarter were 27 cents in the quarter compared with the net earnings of 96 cents recorded in the prior-year quarter.
Lindsay generated revenues of $121.1 million, down 29% year over year. The revenue figure also missed the Zacks Consensus Estimate of $137 million.
Lindsay Corporation Price, Consensus and EPS Surprise
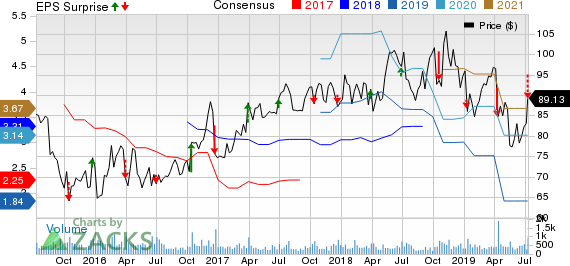
Lindsay Corporation price-consensus-eps-surprise-chart | Lindsay Corporation Quote
Operational Update
Cost of operating revenues was down 22.8% year over year to $91 million. Gross profit plunged 41.7% to $30 million from the $51.5 million witnessed in the year-earlier quarter. Gross margin came in at 24.7% compared to the 30.4% recorded in the year-ago quarter.
Operating expenses declined 21.7% year over year to $25.5 million in the fiscal third quarter. The company reported an operating income of $4.5 million compared to the $18.8 million recorded in the prior-year quarter.
Segment Results
Irrigation segment revenues declined 23% year over year to $98.6 million in the fiscal third quarter. North America irrigation revenues increased 5% from the year-ago quarter while International irrigation revenues decreased 13% year over year. The segment’s operating income was down 36% year over year to $11.6 million. Its operating margin was affected by lower equipment sales volumes and replacement parts in North America.
Infrastructure segment revenues plummeted 45% year over year to $22.4 million, owing to year-over-year soft Road Zipper System sales. The segment reported operating income of $3.6 million compared to the operating income of $14.4 million recorded in the prior-year period.
Financial Position
Lindsay had cash and cash equivalents of $110.8 million at the end of the fiscal third quarter compared to the $111.8 million recorded at the end of the year-ago quarter. The company utilized $19.6 million of cash in operating activities in the quarter compared with cash inflow of $8 million in the prior-year quarter. Lindsay had a long-term debt of $116 million at the end of the reported quarter, stable year on year.
Lindsay’s backlog as of May 31, 2019, was $42.5 million compared with $55.8 million as of May 31, 2018. Approximately $12.4 million of the backlog reduction was due to business divestitures.
Growth Initiatives
In 2018, Lindsay introduced a performance improvement initiative — Foundation for Growth — with the objective of simplifying its business. One of its key financial objectives is to achieve operating margin performance between 11% and 12% in fiscal 2020.
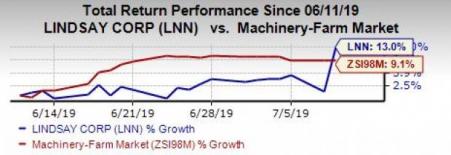
Over the past month, shares of Lindsay have appreciated 13%, outperforming the industry’s growth of 9.1%.
Zacks Rank & Stocks to Consider
Lindsay currently carries a Zacks Rank #3 (Hold).
A few better-ranked stocks in the Industrial Products sector are Graphic Packaging Holding Company (NYSE:GPK) , Roper Technologies, Inc. (NYSE:ROP) and Valmont Industries, Inc. (NYSE:VMI) each sporting a Zacks Rank #1 (Strong Buy), at present. You can see the complete list of today’s Zacks #1 Rank stocks here.
Graphic Packaging has an estimated earnings growth rate of 4.9% for the ongoing year. The company’s shares have gained 0.7% over the past month.
Roper Technologies has an expected earnings growth rate of 9.4% for the current year. The stock has appreciated 2.5% in the one month time period.
Valmont Industries has a projected earnings growth rate of 12.6% for 2019. The stock has gained 7% over the past month.
Breakout Biotech Stocks with Triple-Digit Profit Potential
The biotech sector is projected to surge beyond $775 billion by 2024 as scientists develop treatments for thousands of diseases. They’re also finding ways to edit the human genome to literally erase our vulnerability to these diseases.
Zacks has just released Century of Biology: 7 Biotech Stocks to Buy Right Now to help investors profit from 7 stocks poised for outperformance. Our recent biotech recommendations have produced gains of +98%, +119% and +164% in as little as 1 month. The stocks in this report could perform even better.
See these 7 breakthrough stocks now>>
Graphic Packaging Holding Company (GPK): Free Stock Analysis Report
Roper Technologies, Inc. (ROP): Free Stock Analysis Report
Lindsay Corporation (LNN): Free Stock Analysis Report
Valmont Industries, Inc. (VMI): Free Stock Analysis Report
Original post
Zacks Investment Research