Here we are at June 30 already. The date is a significant one not only because we all get to make our token complaint about how fast the year has already gone, but because big investment funds and corporations are making end of financial year/end of quarter adjustments to their balances by squaring up some of their longer term positions.
In the EOFY square up process however, a lot of positions are being closed simply as a facade for reporting purposes and the positions are just as likely to be re-entered at the tick over of the calendar tomorrow once again. This means that moves are often exaggerated and then re-traced.
There are plenty of headlines buzzing around attributing the big moves we’re seeing across markets to a ‘calming down’ following some post-Brexit over-reaction. Take your pick what you want to attribute it to, but the bottom line is that either way, the retrace is exaggerated and built on uncertain foundations. Not the best fundamental reason to be basing trades around.
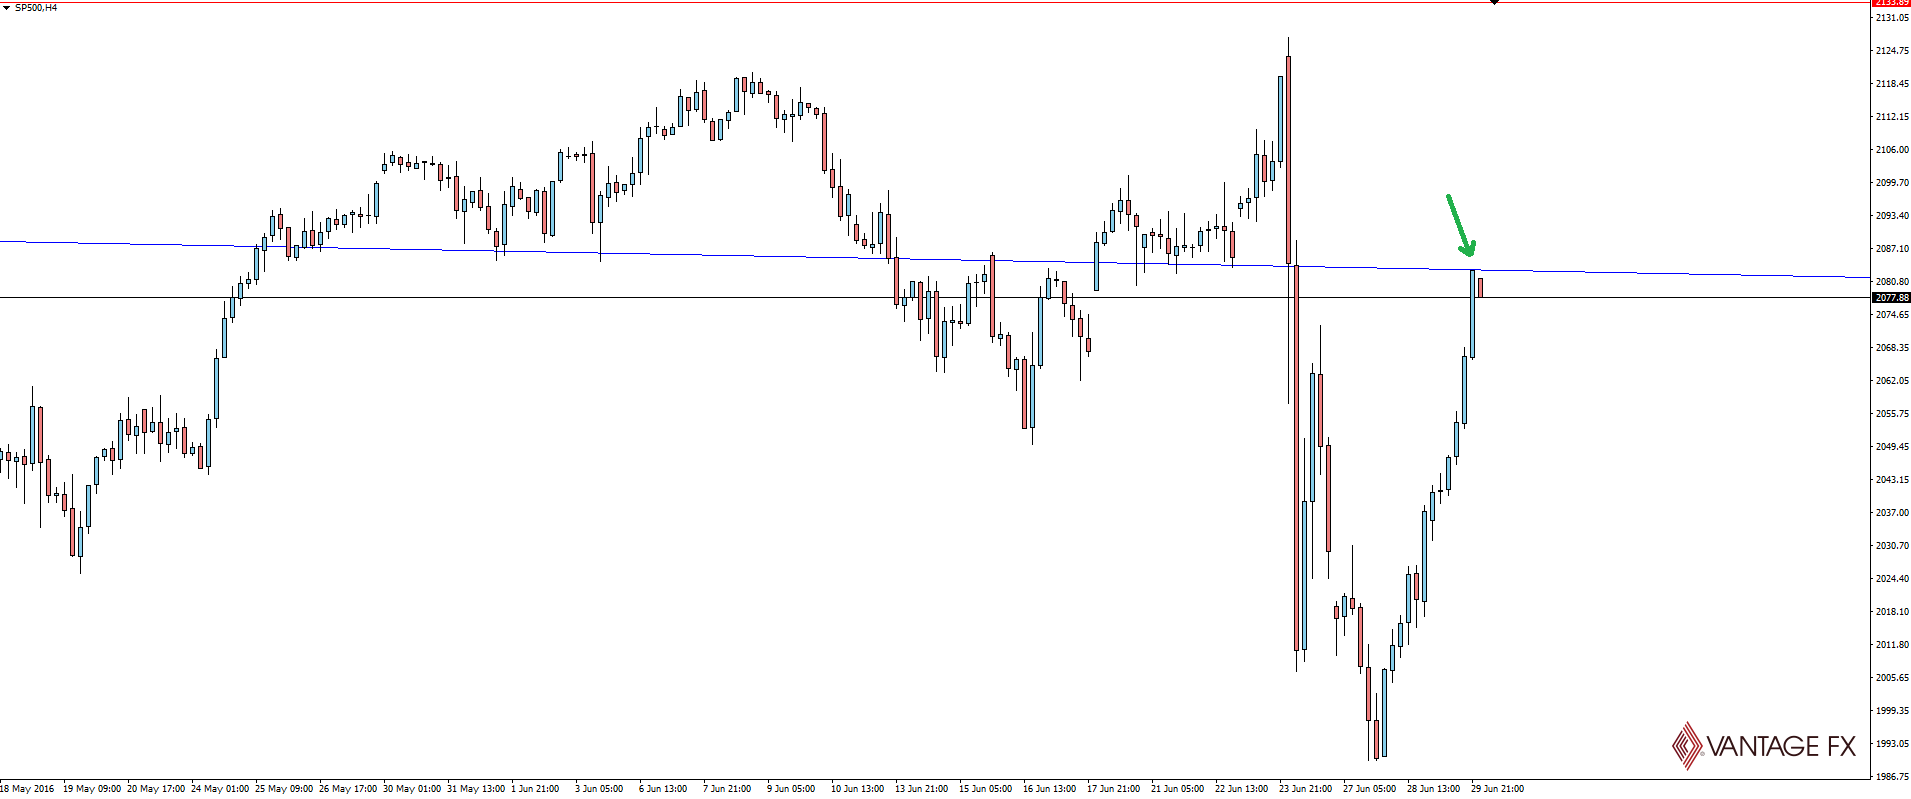
US stocks moved back into the black for 2016, retracing more than half of the Brexit drop in just two days. Really an amazing statement when you stop and think about what we’ve gone through these last few weeks.
Moving onto the technicals and in Tuesday’s look at Indices I had this to say about the S&P:
“Coming out of higher time frame resistance and no momentum (plus new lows) on the lower time frame charts when it tried to retrace some of the panic. While I’m not as bearish as some post Brexit, the charts are saying that the panic selling on the back of uncertainty isn’t done yet.”
From there, we’ve basically had a session and a half of solid, vertical rallying…
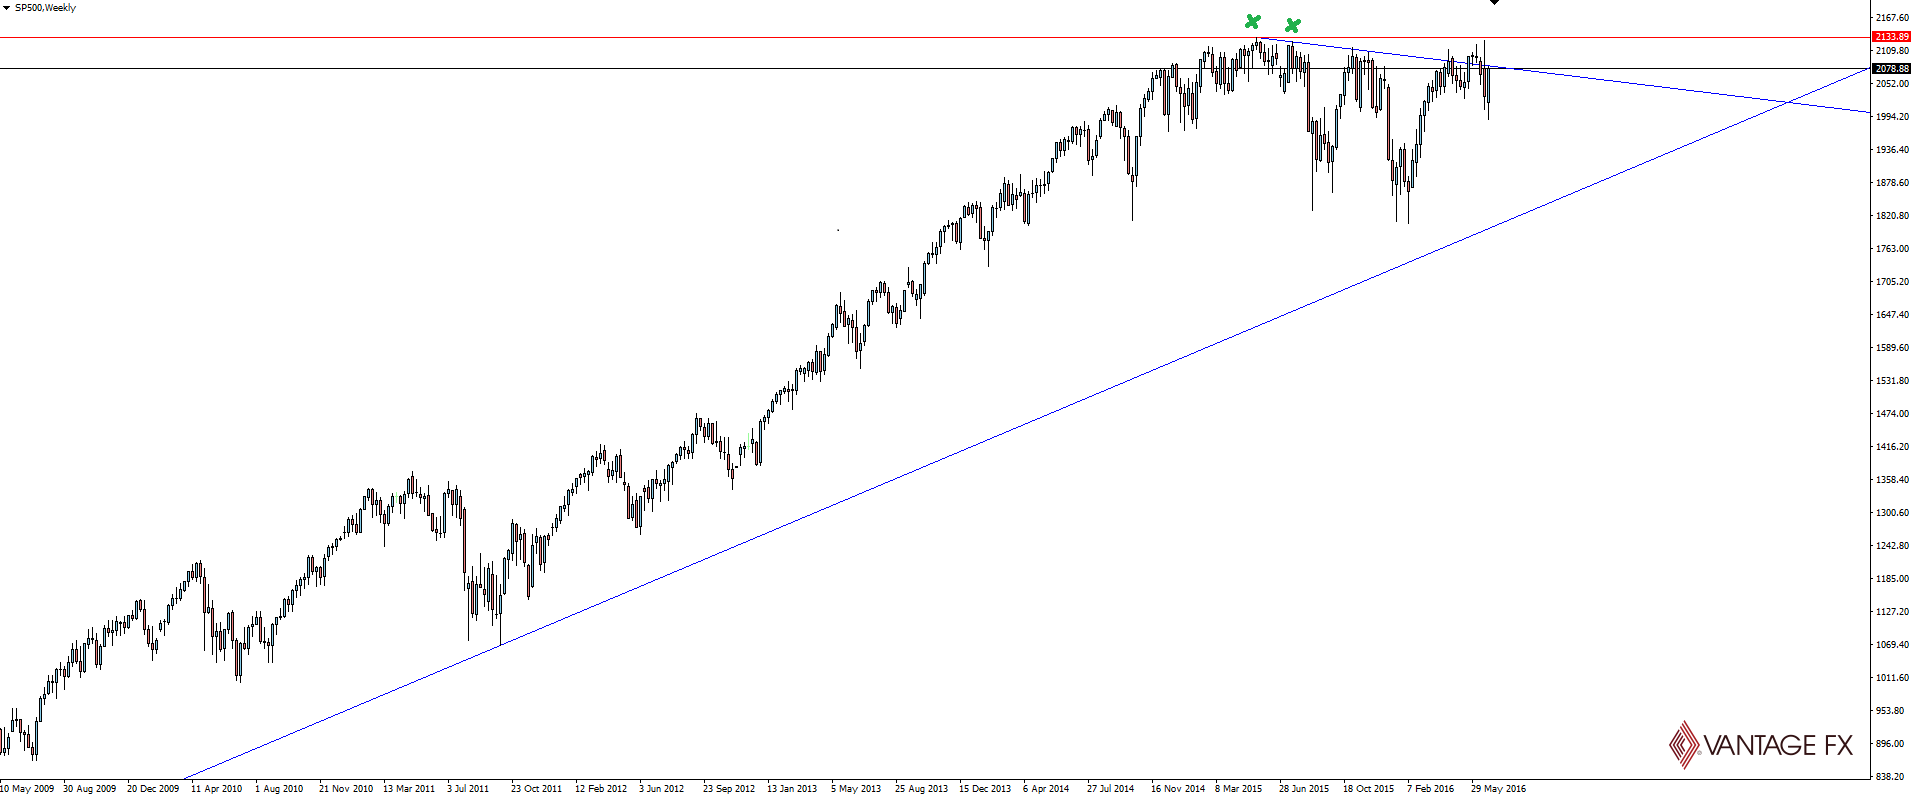
S&P 500 Weekly:
The higher time frame resistance doesn’t change but zooming into an intra-day 4 hourly chart, there’s no missing that retrace!
One conversation topic that this does bring up, is from which points should you draw your trend lines? Should you choose the first two points, or if a third/fourth wick breaks through the original line, should you then adjust the starting points?
For me personally, I still like to leave the line drawn from the first two touches, but really its all about where price reacts. Don’t be afraid to draw multiple versions of the same trend line on your chart to see the levels price is respecting. Remember that trend lines are still a subjective level and you should be looking for some sort of support/resistance confluence around them anyway.
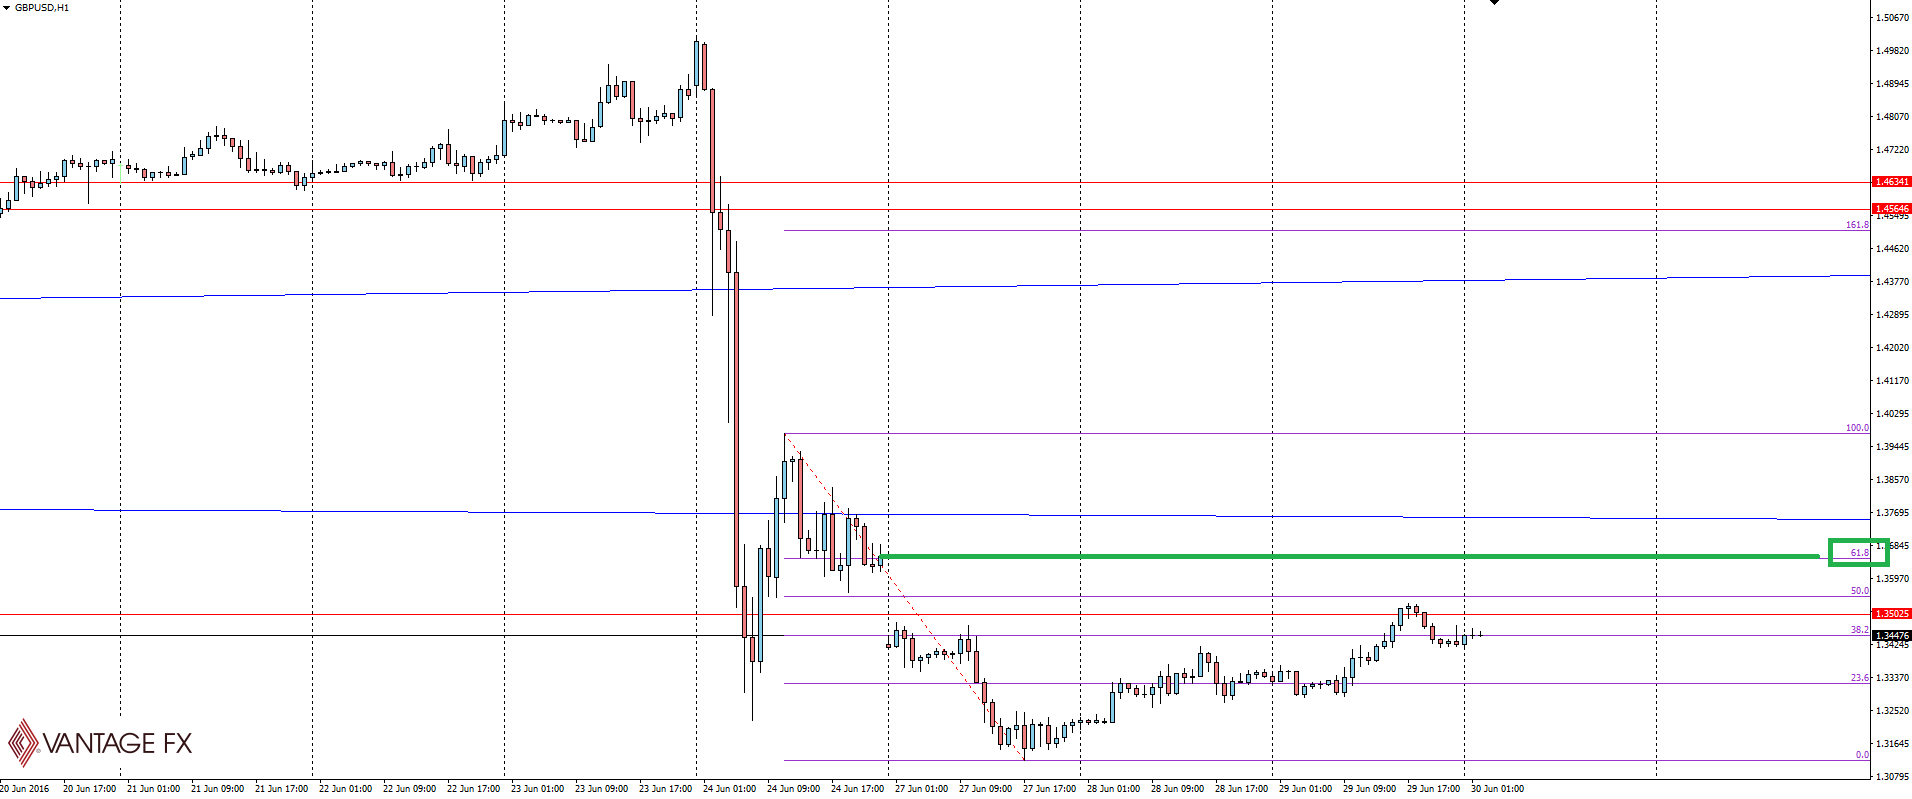
The other forward looking level that jumped out at me this morning is the gap fill level on Cable:
GBP/USD Hourly:
The level where the weekend gap would be filled also lines up with the 60.8% fib retracement from the two most recent intra-day swings points. Whenever you get a confluence like this, no matter how flimsy you think the level might be, it’s worth taking notice.
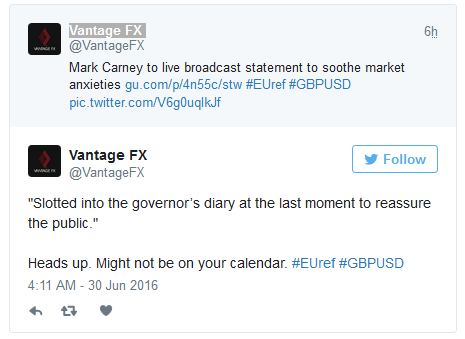
With so many charts to look at and so little time, make sure you keep an eye on the @VantageFX Twitter account throughout the day as we expand on what we’ve spoken about here on the blog.
On the Calendar Thursday:
GBP Current Account
CAD GDP m/m
USD Unemployment Claims
USD FOMC Member Bullard Speaks

Risk Disclosure: In addition to the website disclaimer below, the material on this page prepared by Forex broker Vantage FX Pty Ltd does not contain a record of our prices or solicitation to trade. All opinions, news, research, tools, prices or other information is provided as general market commentary and marketing communication – not as investment advice. Consequently any person acting on it does so entirely at their own risk. The experts writers express their personal opinions and will not assume any responsibility whatsoever for the Forex account of the reader. We always aim for maximum accuracy and timeliness, and FX broker Vantage FX shall not be liable for any loss or damage, consequential or otherwise, which may arise from the use or reliance on this service and its content, inaccurate information or typos. No representation is being made that any results discussed within the report will be achieved, and past performance is not indicative of future performance.

