When I was a new trader, I believed it was quite difficult to find a monster stock that could double in price within a month or two.
But I quickly learned that I was wrong.
On the contrary, it is not unusual for high-momentum small-cap growth stocks to rapidly score such massive gains.
However, what is challenging is simply holding onto your winning stocks long enough to realize those jumbo profits.
In order to do so, you’re going to need discipline to buy at the right time and patience to let the gains accumulate.
Continue reading to see how that reliable recipe of discipline and patience led to an individual stock gain of more than 70% over a six-week period.
Dispose Of The Disposition Effect
Selling your winning stocks too quickly, while holding onto your losing positions too long, is an extremely common mistake among newer traders and investors.
Nevertheless, learning to avoid this psychological pitfall (known as the Disposition Effect) is absolutely crucial to your long-term success as a trader or investor.
Otherwise, you will never be able to make the mathematics of profitable stock trading work in your favor.
So, let’s look at an actual current example of how buying a stock at the right time (not late to the party) makes it easier to let your winners ride.
Applied Opt (NASDAQ:AAOI)
+70% Gain In 6 Weeks
One of the best small-cap stocks of 2017, Applied Optoelectronics (AAOI) has more than doubled in the first quarter of the year.
With ~70% gain since our January 30 entry, AAOI is also one of the top stock picks so far this year.
The Low-Risk Buy Setup
Applied Optoelectronics first appeared as an “official” trade setup in the January 30 issue of The Wagner Daily.
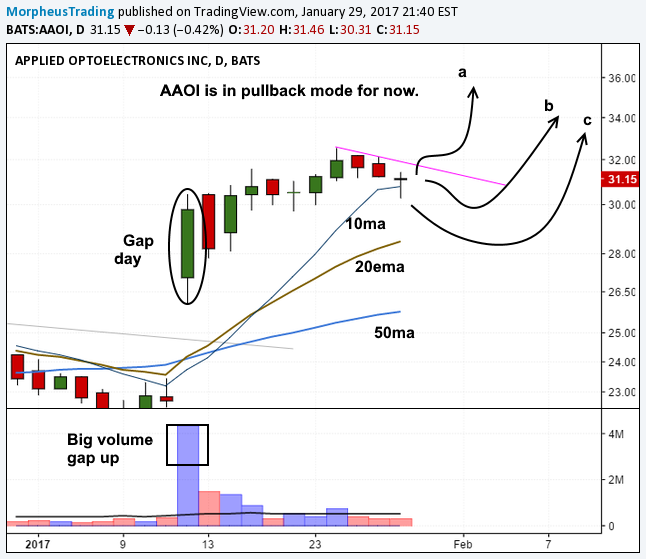
Here is a recap of the chart and technical commentary we shared with subscribers that day:

Here is the exact January 30 commentary that accompanied the chart above:
There is one new official setup on today’s watchlist in AAOI, which recently gapped to all-time highs on big volume and is now in pullback mode after printing a lower high and lower low last Friday. We do not expect much of a pullback, so we are placing a buy limit order just above $30 as the entry.
If scenario A plays out, then we could miss the entry as a move above last Friday’s high could generate some buying interest. Scenario B is the one we are going with, which is a slight pullback/undercut of the $30 area. Scenario C is a slightly deeper pullback to the 20-day EMA, which would be the most patient entry, but one that also presents the highest risk of missing out on the trade. Regardless of which scenario triggers, we expect the price action to hold above the rising 20-day EMA on a closing basis, so our stop is below the 20-day EMA minus some wiggle room.
The scenarios on the chart below give you an idea of how we think, but anything can happen to the price action, including a pullback to the 50-day MA that undercuts the low of the gap up day.
Multiple Timeframe Confirmation
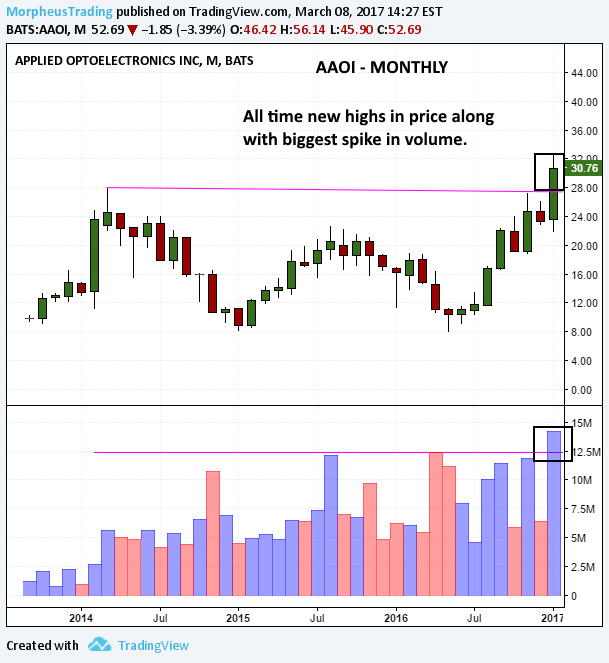
Zooming out to see the “big picture” trend, the long-term monthly chart of AAOI confirmed the bullish setup on the daily timeframe.
Notice that AAOI had also broken out to a new all-time high in January, which was properly accompanied by a volume surge on the monthly chart:

The Buy Entry
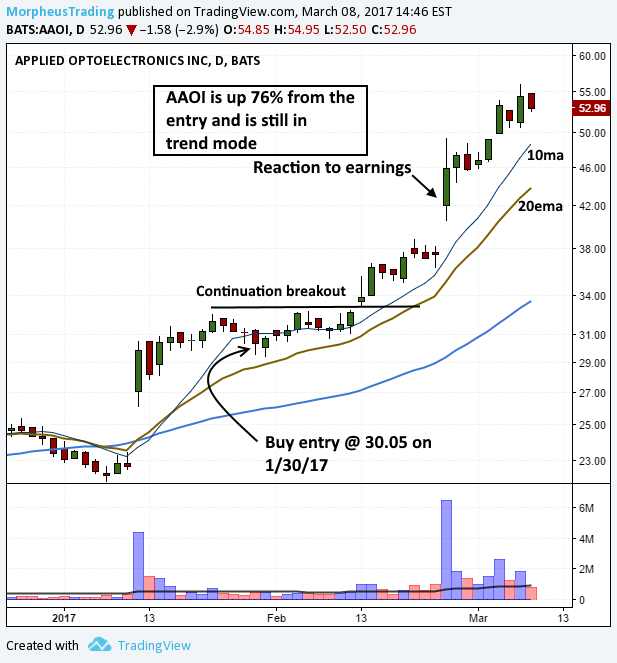
As anticipated, AAOI triggered the Wagner Daily buy limit order by pulling back to $30.05 on January 30 (“Scenario B”).
However, the price did not immediately break out to the upside.
Instead, the price chopped around within the base for two more weeks before breaking out to another fresh high ahead of its February 23 earnings report.
That continuation of the initial January 12 breakout was quite important because it created a large enough profit buffer to hold the position through earnings.
With a +24.7% unrealized gain from the January 30 entry, even a worse than expected earnings report put the position in little risk of turning into a loss.
Rather, the profit buffer gave us confidence to continue holding the position through its late February earnings report.
That’s when this trade started getting much more exciting for newsletter subscribers!
Moonshot Mode
On February 24, traders swiftly and decisively showed their appreciation for Applied Optoelectronics exceeding their Q4 earnings estimates.
That day, AAOI jumped 20% (from $38 to $46) in just one session, then cruised another 20% higher over the next two weeks.
The chart below shows our initial buy entry, the continuation breakout, and the post-earnings breakout:

Resisting Temptation: Staying Long & Strong
Since its mid-February breakout, AAOI has easily remained above support of its 10-week moving average (similar to 50-day moving average).
In a steady uptrend for the past month, the price action of Applied Optoelectronics simply has not yet given us a technical reason to sell.
As such, the model portfolio of The Wagner Daily remains long AAOI with an unrealized gain of about +70% since our January 30 buy entry.
Although it’s tempting to lock in the profit, we will patiently keep sitting on our hands until there is a good reason to sell.
Mainly, we are on the lookout for any telltale signs of rally exhaustion.
When this starts to occur, we will raise the stop higher to remove the “wiggle room” and maximize the trade profit.
As always, subscribing members will be instantly alerted when action is eventually taken to lock in profits with AAOI.
In the meantime, stay disciplined, patient, and keep enjoying the ride.
