
A major boost in the residential market, and infrastructural and construction spending should continue to favor the Zacks Building Products - Air Conditioner and Heating industry in 2020. Also, prudent cost-management practices, leveraging technologies and accretive acquisitions are likely to benefit industry players like Lennox International Inc. (NYSE:LII) , Watsco, Inc. (NYSE:WSO) , Comfort Systems USA, Inc. (NYSE:FIX) , Tecogen Inc. and AAON, Inc. (NASDAQ:AAON) .
The U.S. housing market has been experiencing higher demand, courtesy of lower mortgage rates and solid job market. The heating, ventilation, air conditioning and refrigeration (“HVACR”) markets are bound to get a boost from underlying strength in the housing market. Moreover, higher construction spending activity in non-residential, commercial and industrial sectors is a boon to the industry, in turn boosting the companies’ revenues and profits.
However, the aforementioned growth factors seem to be weighed down by headwinds arising from rising costs, heavy governmental regulation and competitive pressure.
Among the industry bellwethers, Lennox and Watsco are the most recognized. Notably, both the companies carry a Zacks Rank #3 (Hold). You can see the complete list of today’s Zacks #1 Rank (Strong Buy) stocks here.
Let’s delve deeper into both the company’s growth and profitability measures.
Business Performance & Market Cap
With a market cap of $9.39 billion, Lennox designs, manufactures and markets a broad range of products for the HVACR industry. Notably, its products and services are sold through multiple distribution channels under various brand names.
The company’s strategy is to sustain and expand market position, while offering a full spectrum of products to meet customers’ needs. It focuses on cost-reduction initiatives to drive margin expansion and support growth. Moreover, new investments for the expansion of distribution footprint, research and development projects, as well as recent marketing programs are expected to be conducive to the company’s top line.
In contrast, Florida-based Watsco — with a market cap of $6.86 billion — operates as a leading distributor of HVACR products to the industry in North America. Watsco distributes products in 603 locations (as of Sep 30, 2019) and sources supply from major industry players like Rheem, Carrier, Nordyne, Goodman, Trane, and Lennox.
Continued investment in the technologies designed to revolutionize customer experience and strong industry fundamentals, including healthy replacement demand, confident consumers and rising price/mix, will likely translate into better cash flow and returns.
Stock Performance This Year
Lennox’s shares have gained 19% over a year, comparing unfavorably with Watsco’s 35.7% rally. The Homebuilding industry has gained 16.3% during the period. Hence, Watsco fared much better than Lennox in this parameter.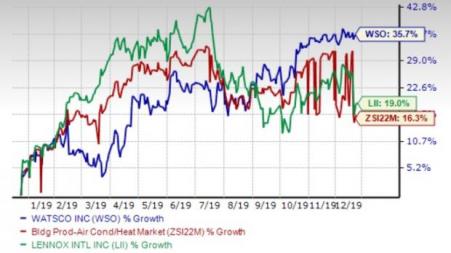
Prospects & Surprises
Analysts expect Lennox’s earnings to grow at a 3.5% rate in 2020. Comparatively, Watsco’s earnings are expected to grow 7.2% over the same time frame. Hence, Watsco’s higher growth rate implies greater potential for capital appreciation.
Meanwhile, considering a more comprehensive earnings history, Lennox delivered a positive surprise in two of the last four quarters, while Watsco did not come up with positive surprise in any of the trailing four quarters. Hence, Lennox is better than Watsco in terms of surprise history.
Profitability and Returns
Return on Capital of Lennox is 48%, while that of Watsco and the industry is 13.4% and 19.3%, respectively. This signifies that Lennox’s business generates a higher return on investment than Watsco.
Return on Equity (ROE) in the trailing 12 months for Lennox is a negative of 199.1%, while that of Watsco is 15.1%. Markedly, both the companies provide lower returns to investors compared with the industry’s 27.9%.
A Look at the Stocks’ Valuation
The trailing 12-month price-to-earnings (P/E) multiple for Lennox and Watsco is 22.81 and 27.68, respectively, while that of the industry is 23.46. Trailing 12-month price-to-sales (P/S) multiples for Lennox and Watsco are 2.53 and 1.34, respectively, compared with the industry’s 1.57. Watsco is the cheaper of the two stocks on a P/E and P/S basis.
Final Verdict
Watsco appears to be a comparatively better investment option than Lennox.
Both the companies remain optimistic about growth trends in the industry, given solid demand, favorable job market and strength in economic fundamentals, offsetting industry woes.
Just Released: Zacks’ 7 Best Stocks for Today
Experts extracted 7 stocks from the list of 220 Zacks Rank #1 Strong Buys that has beaten the market more than 2X over with a stunning average gain of +24.6% per year.
These 7 were selected because of their superior potential for immediate breakout.
See these time-sensitive tickers now >>
Watsco, Inc. (WSO): Free Stock Analysis Report
AAON, Inc. (AAON): Free Stock Analysis Report
Lennox International, Inc. (LII): Free Stock Analysis Report
Comfort Systems USA, Inc. (FIX): Free Stock Analysis Report
Original post
Zacks Investment Research
- English (UK)
- English (India)
- English (Canada)
- English (Australia)
- English (South Africa)
- English (Philippines)
- English (Nigeria)
- Deutsch
- Español (España)
- Español (México)
- Français
- Italiano
- Nederlands
- Português (Portugal)
- Polski
- Português (Brasil)
- Русский
- Türkçe
- العربية
- Ελληνικά
- Svenska
- Suomi
- עברית
- 日本語
- 한국어
- 简体中文
- 繁體中文
- Bahasa Indonesia
- Bahasa Melayu
- ไทย
- Tiếng Việt
- हिंदी
Lennox Or Watsco: Which HVACR Stock Is Worth A Bet Now?
Published 12/22/2019, 10:02 PM
Updated 07/09/2023, 06:31 AM
Lennox Or Watsco: Which HVACR Stock Is Worth A Bet Now?
Latest comments
Loading next article…
Install Our App
Risk Disclosure: Trading in financial instruments and/or cryptocurrencies involves high risks including the risk of losing some, or all, of your investment amount, and may not be suitable for all investors. Prices of cryptocurrencies are extremely volatile and may be affected by external factors such as financial, regulatory or political events. Trading on margin increases the financial risks.
Before deciding to trade in financial instrument or cryptocurrencies you should be fully informed of the risks and costs associated with trading the financial markets, carefully consider your investment objectives, level of experience, and risk appetite, and seek professional advice where needed.
Fusion Media would like to remind you that the data contained in this website is not necessarily real-time nor accurate. The data and prices on the website are not necessarily provided by any market or exchange, but may be provided by market makers, and so prices may not be accurate and may differ from the actual price at any given market, meaning prices are indicative and not appropriate for trading purposes. Fusion Media and any provider of the data contained in this website will not accept liability for any loss or damage as a result of your trading, or your reliance on the information contained within this website.
It is prohibited to use, store, reproduce, display, modify, transmit or distribute the data contained in this website without the explicit prior written permission of Fusion Media and/or the data provider. All intellectual property rights are reserved by the providers and/or the exchange providing the data contained in this website.
Fusion Media may be compensated by the advertisers that appear on the website, based on your interaction with the advertisements or advertisers.
© 2007-2024 - Fusion Media Limited. All Rights Reserved.