
Legg Mason Inc. (NYSE:LM) reported a positive earnings surprise of 8.4% in third-quarter fiscal 2020 (ended Dec 31). The company recorded adjusted net income of $1.03 per share, outpacing the Zacks Consensus Estimate of 95 cents. Further, the reported figure climbed 19.8% year over year.
Higher assets under management (AUM), top-line strength and disciplined expense management drove the company’s performance. However, equity outflows were a major drag during the quarter.
Including certain one-time items, Legg Mason recorded net income of $74.8 million or 83 cents per share as against the net loss of $216.9 million or $2.55 per share reported in the year-ago quarter.
Revenues Up, Expenses Drop
Legg Mason’s total adjusted operating revenues in the fiscal third quarter came in at $638.9 million, up 8.6% year over year. Including certain items, operating revenues were $753.9 million, up 7% year over year. This upsurge mainly resulted from increased advisory fee revenues and performance fees. Also, the revenue figure outpaced the Zacks Consensus Estimate of $732.2 million.
Investment advisory fees climbed 8.6% year over year to $685 million in the quarter. Yet, distribution and service fees were down 6.4% year over year to $67.6 million. Additionally, other revenues slumped 23.5% year over year to $1.3 million.
Operating expenses slipped 33.7% to $623.9 million on a year-over-year basis. This downside chiefly resulted from lower distribution and other costs, partly offset by higher compensation and benefits.
Non-operating expense came in at $5.3 million, plummeting 82.5% year over year.
Adjusted operating margin of Legg Mason was 26.5% in the December-end quarter, up from the 22.1% recorded in the prior-year quarter.
Assets Position
As of Dec 31, 2019, Legg Mason’s AUM was $803.5 billion, up 10.5% year over year from $727.2 billion. Of the total AUM, fixed income constituted 56%, equity 27%, liquidity 8% and alternatives represented 9%.
Moreover, AUM ascended 2.8% on a sequential basis from the $781.8 billion as of Sep 30, 2019, driven by an encouraging market performance of $20.9 billion and positive foreign exchange of $3 billion. These were partly countered by long-term outflows of $1.6 billion and $0.6 billion in realizations.
Notably, long-term flows included equity outflows of $4.8 billion, partly offset by fixed income inflows of $1.7 billion and alternative inflows of $1.5 billion.
Additionally, average AUM was $791.7 billion compared with the $739.3 billion witnessed in the year-earlier quarter and $779.8 billion in the previous quarter.
Strong Balance Sheet
As of Dec 31, 2019, Legg Mason had $823.7 million in cash. Total debt was $2 billion. Shareholders’ equity came in at $3.8 billion.
The ratio of total debt to total capital (total equity plus total debt excluding consolidated investment vehicles) was 34% compared with the previous quarter’s 35%.
Our Viewpoint
We believe Legg Mason has the potential to outperform its peers over the long run, given the company’s diversified product mix and leverage in the changing market demography. In addition to these, with strategic acquisitions, restructuring initiatives and cost-cutting measures, we anticipate the company’s operating efficiencies to improve.
Though equity outflows are a key concern, prudent expense management and higher AUM remain driving factors.
Legg Mason, Inc. Price, Consensus and EPS Surprise
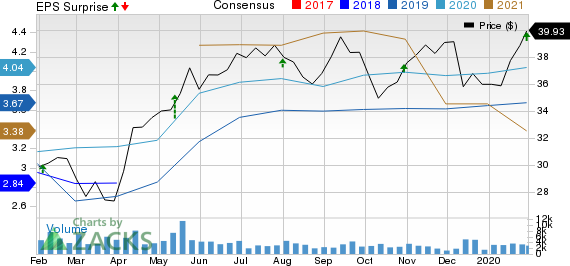
Legg Mason, Inc. price-consensus-eps-surprise-chart | Legg Mason, Inc. Quote
Legg Mason currently carries a Zacks Rank #2 (Buy). You can see the complete list of today’s Zacks #1 Rank (Strong Buy) stocks here.
Performance of Other Asset Managers
BlackRock, Inc.’s (NYSE:BLK) fourth-quarter 2019 adjusted earnings of $8.34 per share surpassed the Zacks Consensus Estimate of $7.67. Moreover, the figure came in 37.2% higher than the year-ago quarter’s number. Results benefited from an improvement in revenues. Moreover, growth in AUM, driven by net inflows, was a positive. However, higher expenses hurt results to some extent.
Cohen & Steers’ (NYSE:CNS) fourth-quarter adjusted earnings of 74 cents per share surpassed the Zacks Consensus Estimate of 67 cents. Also, the bottom line came in 32.1% higher than the year-ago quarter figure. Results benefited from an improvement in AUM and higher revenues. However, rise in expenses was a headwind.
T. Rowe Price Group, Inc. (NASDAQ:TROW) reported a positive earnings surprise of 4.1% in the October-December quarter. Adjusted earnings per share came in at $2.03, outpacing the Zacks Consensus Estimate of $1.95. The reported figure also improved 31.8% from the year-ago quarter.
Breakout Biotech Stocks with Triple-Digit Profit Potential
The biotech sector is projected to surge beyond $775 billion by 2024 as scientists develop treatments for thousands of diseases. They’re also finding ways to edit the human genome to literally erase our vulnerability to these diseases.
Zacks has just released Century of Biology: 7 Biotech Stocks to Buy Right Now to help investors profit from 7 stocks poised for outperformance. Our recent biotech recommendations have produced gains of +50%, +83% and +164% in as little as 2 months. The stocks in this report could perform even better.
See these 7 breakthrough stocks now>>
Cohen & Steers Inc (CNS): Free Stock Analysis Report
BlackRock, Inc. (BLK): Free Stock Analysis Report
T. Rowe Price Group, Inc. (TROW): Free Stock Analysis Report
Legg Mason, Inc. (LM): Free Stock Analysis Report
Original post
Zacks Investment Research