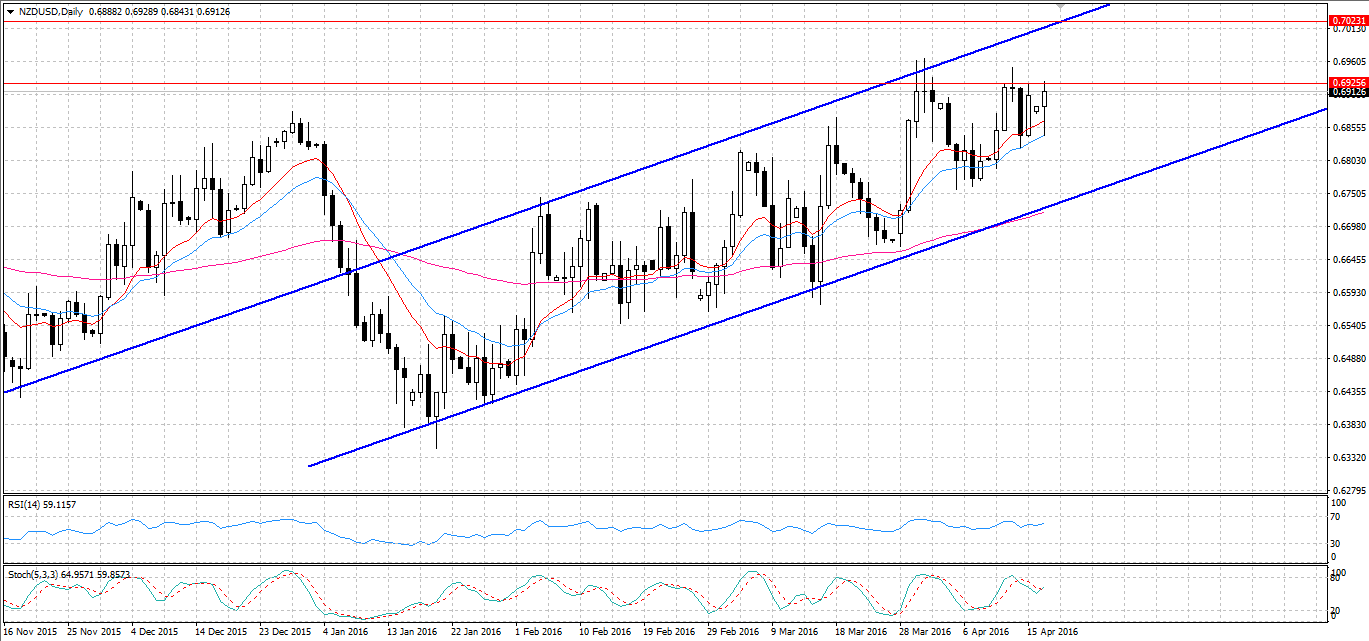
The next few days could be interesting for the kiwi dollar as GDT price index results loom nearer. The indicator remains one of the most influential for the small dairy producing nation’s currency and its outcome could give another boost to the bullish pair. As a result, the market will be watching the index release closely as the additional momentum could see the pair finally break through resistance at 0.6925.
Looking at the week that’s been, the NZD/USD closed the up at 0.6905 despite a rather large fall resulting from the US Fed Beige Book release. In the release, the US reported some substantial improvements in both wage growth and unemployment which sent the pair plunging to 0.6843. Subsequently, a surprise decrease in US unemployment’s claims down to 253K helped to reinforce optimism towards the US economic recovery. Ultimately, the kiwi dollar fought back as Friday’s US preliminary Michigan consumer sentiment index fell to 89.7 rather than posting the expected increase up to 92.0.

In the coming week however, the GDT price index result will play its usual role in generating significant movement for the pair. Consequently, posting another increase in the index might finally give the kiwi dollar the final push it needs to break the 0.6925 zone of resistance. Additionally, the pair has been bullish for some time now and failing to break resistance may represent a new top. In this event, the kiwi dollar may see itself flatten out and move into a ranging pattern instead. Furthermore, if a poor result is posted this could send the pair back to the lower channel constraint or even start the ranging pattern.
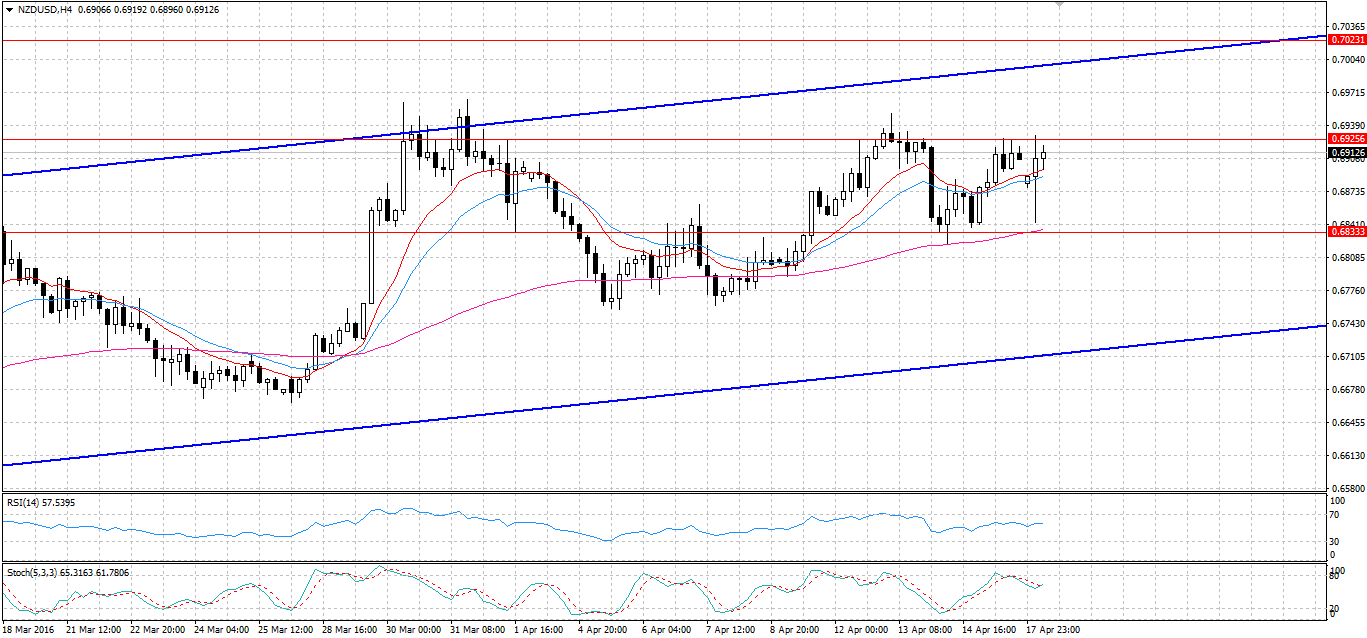
Looking at the technical data, the kiwi dollar has remained constrained within its well-defined bullish channel. In addition to this, the 12, 20, and 100 day EMA’s are still signalling that the NZD/USD is bullish. However, the pair is approaching the 0.6925 zone of resistance which it has challenged but ultimately failed to break multiple times this year. Furthermore, Stochastics and RSI are reading neutral which means there is still some upside potential for the pair in the coming week. Finally, the 100 period EMA on the H4 chart has been providing some strong dynamic resistance which could limit the downside potential of a poor GDT result.

The combined forces of the GDT prices result, and the bullish technicals, could be all this pair needs to spur another strong rally. However, the kiwi dollar will likely remain within the channel and find some very robust resistance at 0.7023. Conversely, whilst the downside potential is limited by the 100 period EMA on the H4 chart, it should not be ignored.

by Matthew Ashley
