
Ken Fisher is an investment analyst and founder, chairman and CEO of Fisher Investments. In his asset management company he serves around USD 37.63 billion. His portfolio invested money on 474 companies; 48 of his stock holdings are completely new.
Ken has big investments within the technology sector but financial shares and consumer stocks are also very important for his asset allocation. His latest portfolio transactions show that he strengthen his technology and commodity side. He bought Cisco and Apple for the tech side and BASF, RIO Tinto, Vale and BP for his commodity bets.
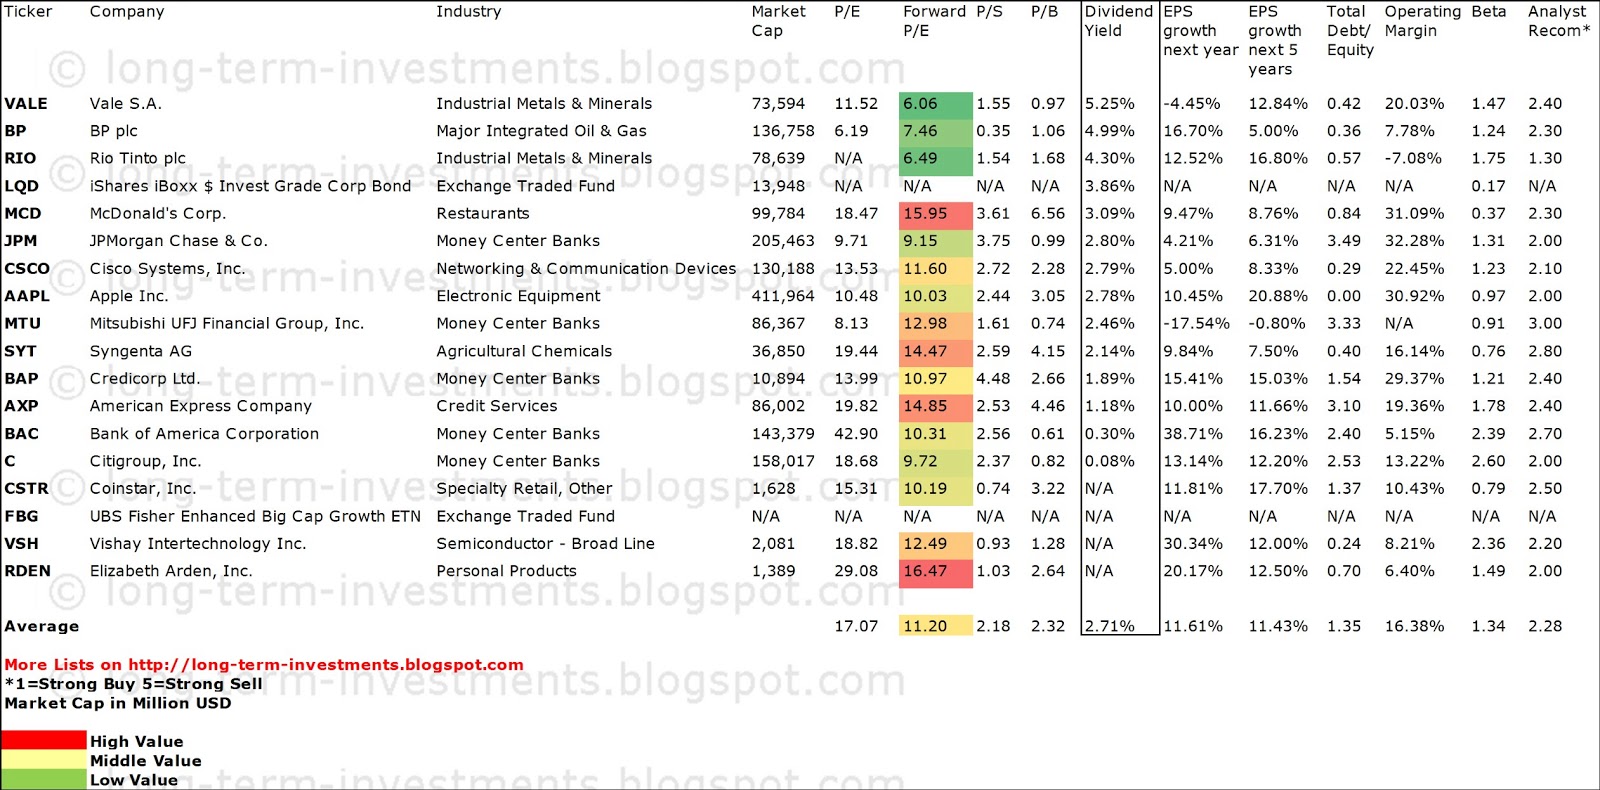
Below is a list of his latest and biggest dividend stock buys as well as his most important portfolio positions.
Sixteen of his 20 top buys from the recent quarter pay dividends and 13 are currently recommended to buy. He's a real large-cap investor but has also some smaller companies. Summarized: Fisher has a very diversified portfolio.
Apple (AAPL) has a market capitalization of $412.60 billion. The company employs 72,800 people, generates revenue of $156.508 billion and has a net income of $41.733 billion. The firm’s earnings before interest, taxes, depreciation and amortization (EBITDA) amounts to $58.518 billion. The EBITDA margin is 37.39 percent (the operating margin is 35.30 percent and the net profit margin 26.67 percent).
Financial Analysis: The total debt represents 0.00 percent of the company’s assets and the total debt in relation to the equity amounts to 0.00 percent. Due to the financial situation, a return on equity of 42.84 percent was realized. Twelve trailing months earnings per share reached a value of $41.89. Last fiscal year, the company paid $2.65 in the form of dividends to shareholders. The AAPL stake was added by 58.12 percent and had an impact of 0.66 percent.
Market Valuation: Here are the price ratios of the company: The P/E ratio is 10.48, the P/S ratio is 2.65 and the P/B ratio is finally 3.51. The dividend yield amounts to 2.76 percent and the beta ratio has a value of 0.97.
BASF (BASFY) has a market capitalization of $89.71 billion. The company employs 111,687 people, generates revenue of $104.094 billion and has a net income of $6.904 billion. The firm’s earnings before interest, taxes, depreciation and amortization (EBITDA) amounts to $16.459 billion. The EBITDA margin is 15.81 percent (the operating margin is 11.40 percent and the net profit margin 6.63 percent).
Financial Analysis: The total debt represents 20.87 percent of the company’s assets and the total debt in relation to the equity amounts to 54.63 percent. Due to the financial situation, a return on equity of 20.03 percent was realized. Twelve trailing months earnings per share reached a value of $6.62. Last fiscal year, the company paid $3.44 in the form of dividends to shareholders. The BASFY stake was added by 404.63 percent and had an impact to his portfolio of 0.59 percent.
Market Valuation: Here are the price ratios of the company: The P/E ratio is 14.75, the P/S ratio is 0.85 and the P/B ratio is finally 2.71. The dividend yield amounts to 3.54 percent and the beta ratio has a value of 1.73.
American Express (AXP) has a market capitalization of $86.00 billion. The company employs 62,400 people, generates revenue of $33.808 billion and has a net income of $4.482 billion. The firm’s earnings before interest, taxes, depreciation and amortization (EBITDA) amounts to $7.442 billion. The EBITDA margin is 22.01 percent (the operating margin is 19.08 percent and the net profit margin 13.26 percent).
Financial Analysis: The total debt represents 41.02 percent of the company’s assets and the total debt in relation to the equity amounts to 332.62 percent. Due to the financial situation, a return on equity of 23.53 percent was realized. Twelve trailing months earnings per share reached a value of $3.95. Last fiscal year, the company paid $0.80 in the form of dividends to shareholders. The AXP stake was added by 19.94 percent and had an impact to his portfolio of 0.32 percent.
Market Valuation: Here are the price ratios of the company: The P/E ratio is 19.80, the P/S ratio is 2.54 and the P/B ratio is finally 4.57. The dividend yield amounts to 1.18 percent and the beta ratio has a value of 1.78. Take a closer look at the full list of Ken Fisher's latest dividend stock buys and his biggest portfolio stock holdings. The average P/E ratio amounts to 17.07 and forward P/E ratio is 11.20. The dividend yield has a value of 2.71 percent. Price to book ratio is 2.32 and price to sales ratio 2.18. The operating margin amounts to 16.38 percent and the beta ratio is 1.34. Stocks from the list have an average debt to equity ratio of 1.35.


Related stock ticker symbols:
VALE, BP, RIO, LQD, MCD, JPM, CSCO, AAPL, MTU, SYT, BAP, AXP, BAC, C, CSTR,
FBG, VSH, RDEN
*I am long MCD, CSCO, . I receive no compensation to write about these specific stocks, sector or theme. I don't plan to increase or decrease positions or obligations within the next 72 hours.
For the other stocks: I have no positions in any stocks mentioned, and no plans to initiate any positions within the next 72 hours. I receive no compensation to write about any specific stock, sector or theme.
The largest dividend stocks buys from Ken Fisher as of Q1/2013 originally published at "long-term-investments.blogspot.com".
- English (UK)
- English (India)
- English (Canada)
- English (Australia)
- English (South Africa)
- English (Philippines)
- English (Nigeria)
- Deutsch
- Español (España)
- Español (México)
- Français
- Italiano
- Nederlands
- Português (Portugal)
- Polski
- Português (Brasil)
- Русский
- Türkçe
- العربية
- Ελληνικά
- Svenska
- Suomi
- עברית
- 日本語
- 한국어
- 简体中文
- 繁體中文
- Bahasa Indonesia
- Bahasa Melayu
- ไทย
- Tiếng Việt
- हिंदी
Ken Fisher's Biggest Dividend-Stock Buys
Published 06/11/2013, 06:37 AM
Updated 07/09/2023, 06:31 AM
Ken Fisher's Biggest Dividend-Stock Buys
3rd party Ad. Not an offer or recommendation by Investing.com. See disclosure here or
remove ads
.
Latest comments
Install Our App
Risk Disclosure: Trading in financial instruments and/or cryptocurrencies involves high risks including the risk of losing some, or all, of your investment amount, and may not be suitable for all investors. Prices of cryptocurrencies are extremely volatile and may be affected by external factors such as financial, regulatory or political events. Trading on margin increases the financial risks.
Before deciding to trade in financial instrument or cryptocurrencies you should be fully informed of the risks and costs associated with trading the financial markets, carefully consider your investment objectives, level of experience, and risk appetite, and seek professional advice where needed.
Fusion Media would like to remind you that the data contained in this website is not necessarily real-time nor accurate. The data and prices on the website are not necessarily provided by any market or exchange, but may be provided by market makers, and so prices may not be accurate and may differ from the actual price at any given market, meaning prices are indicative and not appropriate for trading purposes. Fusion Media and any provider of the data contained in this website will not accept liability for any loss or damage as a result of your trading, or your reliance on the information contained within this website.
It is prohibited to use, store, reproduce, display, modify, transmit or distribute the data contained in this website without the explicit prior written permission of Fusion Media and/or the data provider. All intellectual property rights are reserved by the providers and/or the exchange providing the data contained in this website.
Fusion Media may be compensated by the advertisers that appear on the website, based on your interaction with the advertisements or advertisers.
© 2007-2024 - Fusion Media Limited. All Rights Reserved.