I came across a number of pieces lately from people voicing their concerns over the prospects for junk bonds. And there may be something to their concerns. Still, history appears to suggest that the time to head for the exits may still be yet to come.
First The Bad News
The yields on junk bonds are about as low as they have ever been (at least within about 65 basis points or so). When I went to copy and paste the chart I found, I came across some intense copyright warning so click here to see the chart from the St.Louis Fed website (also click “Max” on the screen that comes up to see roughly 20 years of history). In addition, the spread between junk bond yields and high grade corporate bond yields is also at or near a multi-year low.
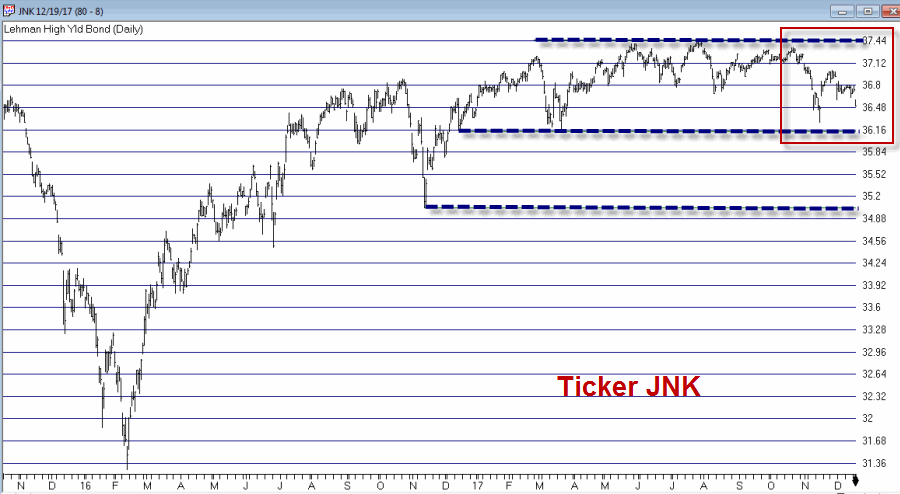
Finally, the price chart for junk bond ETFs is causing some angst as well. See Figure 1. There are some fairly obvious support and resistance levels. Moving out above support looks like a challenge and if one or more of the support levels breaks – well, charting theory suggest that there could be trouble.
SPDR Barclays High Yield Bond (NYSE:JNK)
Figure 1: Courtesy AIQ TradingExpert
Finally, despite the fact that December has typically been a good month for junk bonds (Vanguard High-Yield Corporate) has been up in December for 30 of the past 38 years using monthly total return data). December 2017 is off to a rocky start as you can seen Figure 1.
The 'Not-So-Bad' News
Junk bonds are much more highly correlated to stocks than they are to interest rates and/or treasury bonds. And stocks tend to perform well during the December through April period. So do junk bonds. Typically. And they typically perform much better than straight intermediate-term treasury bonds.
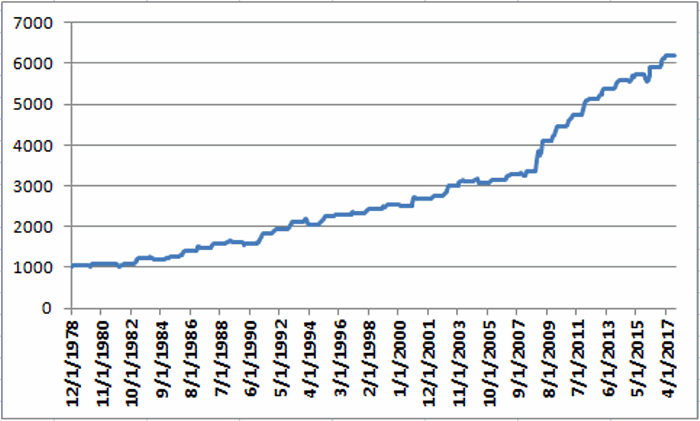
Figure 2 displays the growth of $1,000 invested in ticker VWEHX only during the months of December through April every year starting in January 1979.

Figure 2: $1,000 invested in VWEHX ONLY during December through April; 12/31/1978-11/30/2017.
For the record, December (inclusive) through April since 1979 using monthly total return data for ticker VWEHX:
- Up 34 times (87% of the time)
- Down 5 times (13% of the time)
- Average UP = +5.9%
- Average DOWN = (-2.3%)
- Maximum UP = +16.0%
- Maximum DOWN = (-3.3%)
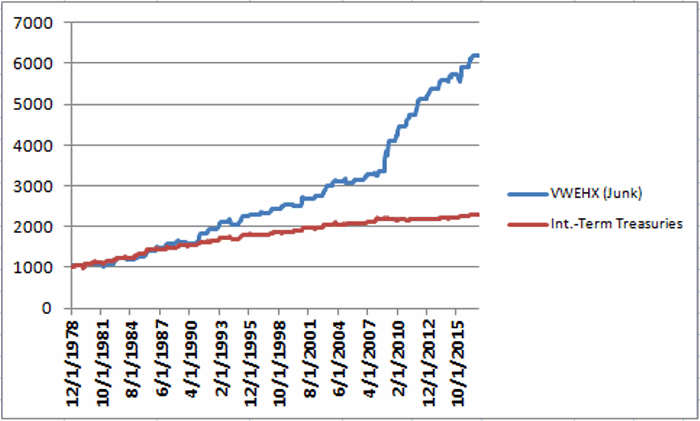
To put this performance into perspective, Figure 3 displays the same line from Figure 2 (blue line) along with the total return growth of $1,000 invested in intermediate-term treasuries (red line).

Figure 3: Total Dec.-Apr. return; 12/31/1978-11/30/2017
Summary
So will history win out as junk bonds break out to the upside between now and the end of April?
Or is this destined to be one of those “exceptions-to-the-rule” kind of years?
It might be wise to keep an eye on the $35.90 to $36.10 support area for JNK. A break below that level might signal trouble. Unless and until that happens, history suggests giving junk bonds the benefit of the doubt in the months just ahead.

