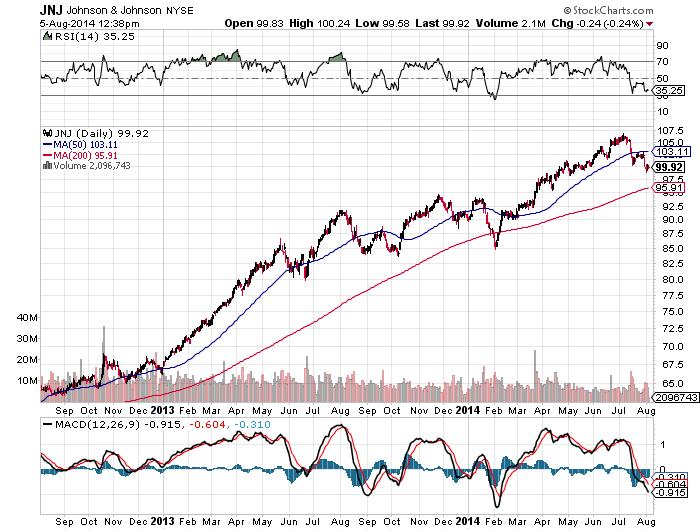
Johnson & Johnson (NYSE:JNJ), which is one of my favorite long-term stocks for income and dividend-reinvesting investors, just dropped below the $100.00-per-share level and is becoming more attractive each day.
This stock has been doing extremely well over the last few years and should continue to do so. The position has been a worthy buy when it’s down and according to its recent trading history, it typically isn’t down for long.
If you’re a shareholder in this company or are considering a long-term position, you’ll want to take a look at the company’s recently filed Securities and Exchange Commission (SEC) Form 10-Q, which was submitted August 1.
This quarterly SEC filing reveals much more information over and above a company’s regular earnings press release. It gives a much better snapshot of a company’s financial position, where the sales are, which divisions are the most profitable, and where the company sees its operations in the near future.
In Johnson & Johnson’s recently filed Form 10-Q, the company’s overall profitability, that is its net earnings as a percentage of total sales, leapt higher from 20.7% to 24.1% in the first half of this year compared to last.
This is a huge accomplishment for a company this large and a major reason why stockholders should feel so confident about increasing dividends in the future, along with more share buybacks.
The company’s average common shares outstanding in the first half of 2014 dropped by approximately 3.3 million shares on a diluted basis compared to the same period last year.
Johnson & Johnson’s two-year stock chart is featured below.

Johnson & Johnson’s most recent quarter was a standout. Within the numbers, U.S. total sales charged ahead by 15% compared to the second quarter of 2013; sales to Europe advanced 8.2%. This was led by a whopping 37% increase in U.S. pharmaceutical sales. International pharmaceutical sales grew 6.8% comparatively.
The company’s pharmaceutical segment produced a sea of double-digit comparative gains. From oncology to immunology, Johnson & Johnson’s pharmaceutical business is booming, and it’s a big reason why earnings as a percentage of total sales are growing.
While all corporate disclosure is to be taken with a grain of salt, the company’s management said that between 2003 and 2013, in the U.S. market, the weighted-average compound annual price increase for its prescription and over-the-counter drugs, as well as its hospital and professional products was actually below that of the Consumer Price Index (CPI).
Regardless, pharmaceuticals are the biggest contributor to sales and earnings and the company is on track to have another very good year.
Johnson & Johnson is a very good candidate for those investors able to participate in dividend reinvestment. Those dividends really add up over time, and there’s nothing like owning more shares in a company at no additional cost to you as a shareholder.
If you bought Johnson & Johnson’s shares in November of 2011, your simple rate of return to date would be approximately 59%. But if you reinvested the dividends Johnson & Johnson paid over the same period, your return improves to approximately 74% and naturally, you own more shares over your original investment.
For a company with a long track record of increasing dividend payments to shareholders, a dividend reinvestment strategy with a stock like Johnson & Johnson should continue to produce excellent returns.
Disclaimer: There is no magic formula to getting rich. Success in investment vehicles with the best prospects for price appreciation can only be achieved through proper and rigorous research and analysis. The opinions in this e-newsletter are just that, opinions of the authors. Information contained herein, while believed to be correct, is not guaranteed as accurate. Warning: Investing often involves high risks and you can lose a lot of money. Please do not invest with money you cannot afford to lose.