It will be a hectic week, with the ISM manufacturing and service reports, along with job data. This will be bond market-moving news, specifically measuring the economic expansion and for signs of inflation.
It makes the prices paid index on the manufacturing report and hourly wages on the BLS job report perhaps two of the most important measures. Both are key measures of inflation and are likely to results in a big response from the bond and currency markets.
The Fed shall keep rates low for a long-time, on the curve’s short-end, meaning 2-years or less. 5-years and out, good luck. The more dovish sounding Powell gets, the more bearish it is for stocks. The bond market hasn’t had an epic tantrum in years, and the bond market is far bigger and far more important to the health of the economy than equities. The bond market may be about to test Powell in a way that will make the fall of 2018 look like child’s play.
It is clear from reading the Fed minutes and Powell’s congressional testimony that the bond market wants Powell to back-off this uber dovish stance and stop placating the equity market. Powell danced around the Q&A sessions, avoiding saying anything that he felt would upset the equity market. But instead, he upset the bond market.
Please make no mistake; Bonds will continue to push this until they either break Powell, getting him to push more QE into the system, or institute yield curve control to stop yields from rising. Or Powell provides clarity about how it plans to stay in front of inflation. That means between Mar. 16 and 17, one should be prepared for a lot of volatility, and the bond market volatility index shows, it may only be starting.
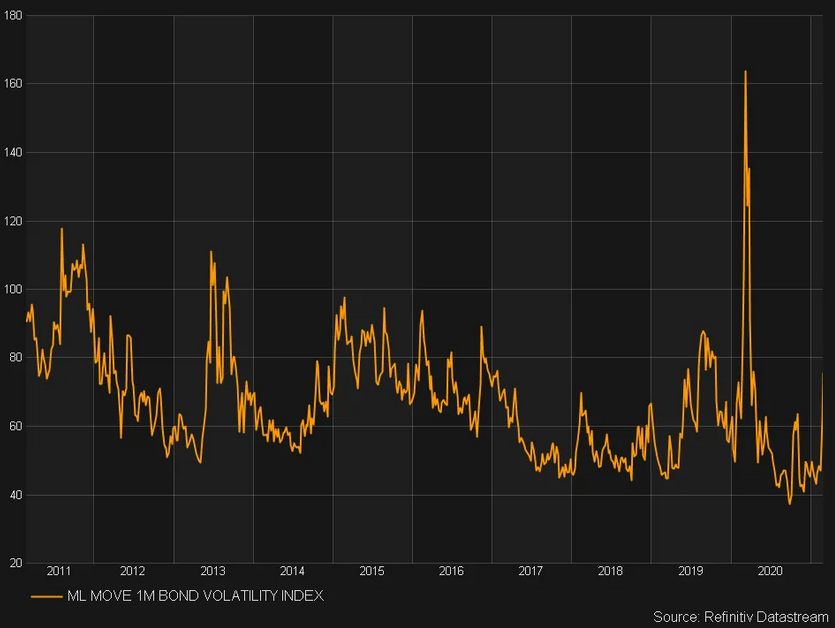
As I have said since December, rising rates were likely to be the force that upset the apple cart for equities, and indeed they have. They have gone up even faster than I anticipated. I was looking for 1.5% in the first half of the year, but we are in are only at the end of February.
If rates retreat some over the next week or two may not matter, the damage has been done. Equity investors will be forced and have already been forced to begin rethinking their discount rates and where rates are likely to remain from here. That is likely to damage valuation and multiples on some higher-flying, higher multiple stocks, specifically in the technology arena. Some of those companies will report results this week like Zoom Video (NASDAQ:ZM), Broadcom (NASDAQ:AVGO), Okta (NASDAQ:OKTA), Snowflake (NYSE:SNOW), Splunk (NASDAQ:SPLK), to name a few.
Investors need to separate these companies from their stocks. They not the same. Just because a company has great prospects doesn’t mean the stock isn’t ahead of itself or overvalued. Phrases like tough second comp, decelerating growth, or higher cost are like death to these of stock, as is the lack of margin expansion, or worse, margin compression. Ask Apple (NASDAQ:AAPL), Facebook (NASDAQ:FB), NVIDIA (NASDAQ:NVDA), Advanced Micro Devices (NASDAQ:AMD), Procter & Gamble (NYSE:PG) and Roku (NASDAQ:ROKU) about these phrases. Investors don’t care about what you have done; they care about what you will do, and if investors have been pricing your revenue to grow at 35% and suddenly, the company says expect revenue to grow at a slower pace in the second half of the year, forget it.
Couple this with rising rates, and suddenly those higher multiples compress dramatically, couple that with lower growth expectations and that equal lower stock prices. This isn’t to say this will happen; it is meant to be an explainer to understand what to look for and for you to understand better why a stock may be falling even though they reported great results or even gave better than expected guidance.
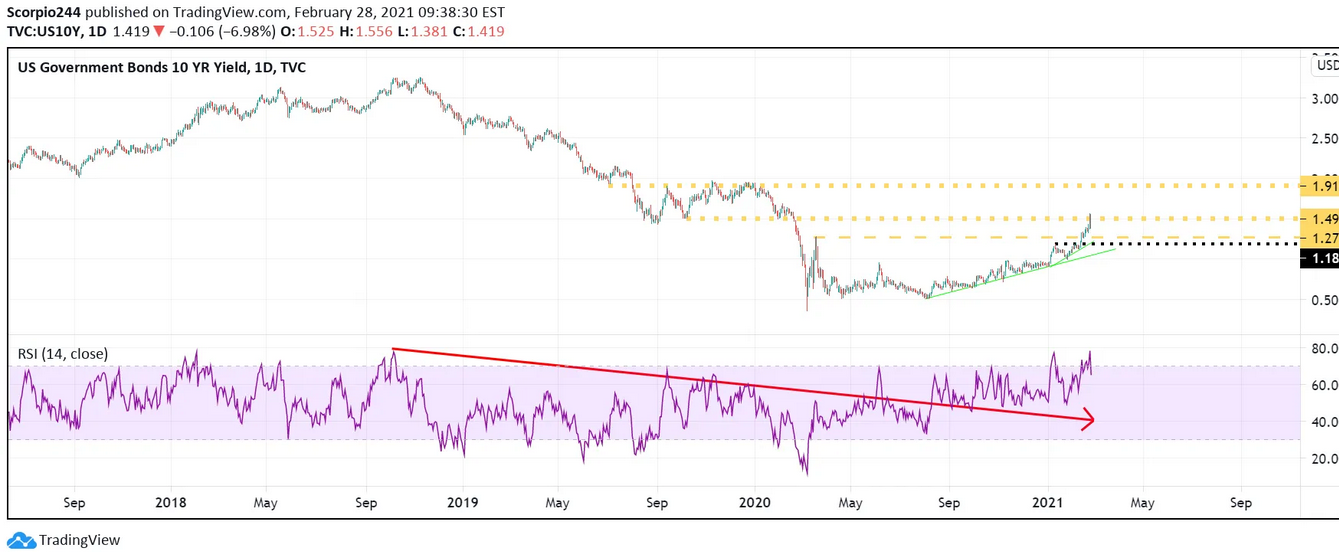
10-Year
If the 10-Year moves above 1.55%, then there is little to stop it from rising to 1.7% or worse 1.95%.
S&P 500
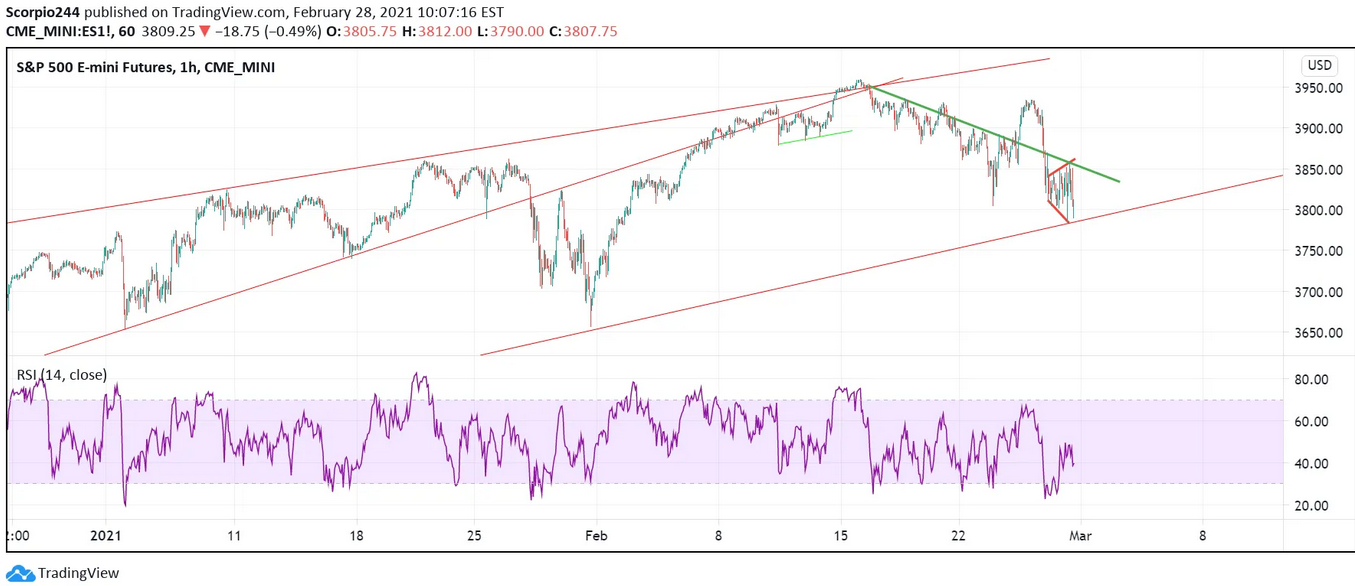
The S&P 500 is sitting on a key level of technical support that was tested last week. Currently, the index is sitting on the March 2020 uptrend, which is a huge level for the futures and the index. There is a minor downtrend that formed off of the 3950 highs, which will continue to act as resistance for the index. A break of the March uptrend sets up a rather dire scenario for the equity market.
NASDAQ 100
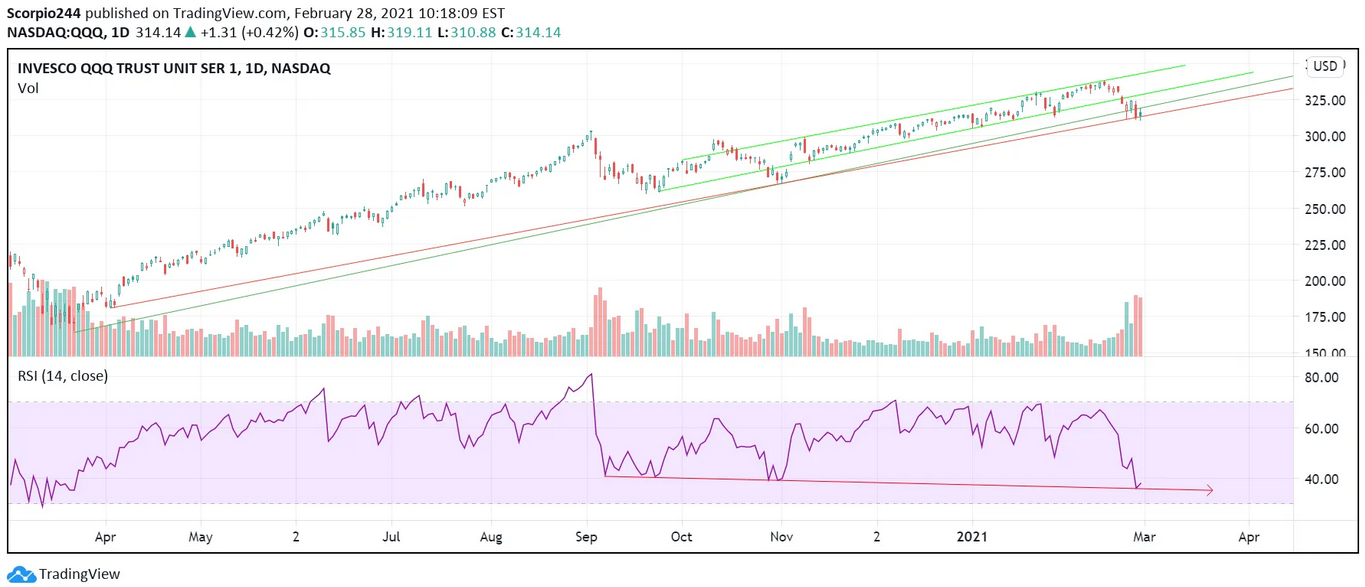
But really, the NASDAQ 100 ETF (QQQ) may already be telling us what comes next. The QQQ has broken below the March uptrend already and now rests on an uptrend that started in April. A break of that uptrend spells a lot of trouble for the NASDAQ. More concerning is that the selling is coming on massive volume levels, while the RSI is now making lower lows and trending down. Both bearish indicators. It is potentially setting up a drop to around $275 on the Qs.
Alibaba
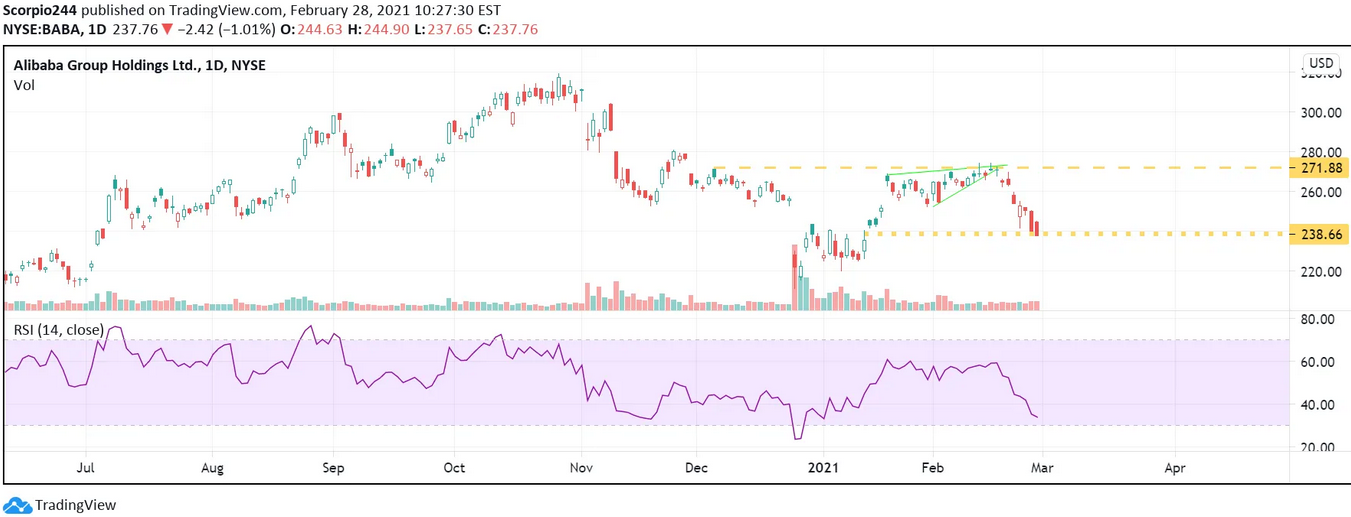
Alibaba (NYSE:BABA) finally came down to that $240 level I noted before the company reported Feb. 1. It took longer than I expected, but better late than never. It seems plausible the stock test support at the bottom of the range around $225 now.
Amazon
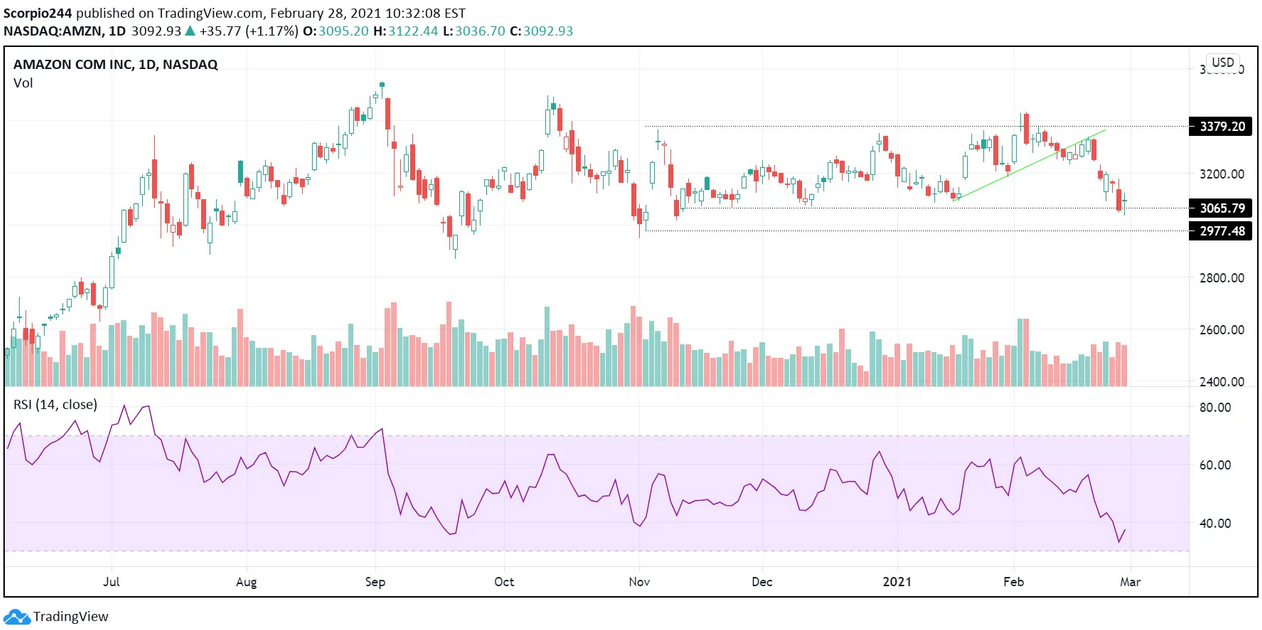
Amazon (NASDAQ:AMZN) has also struggled since reporting results. This is a case of the company telling you that the future will not be as great as the past year and is guiding to lower operating margins. The stock fell back to $3,070, much like I expected. The stock has a little more support that I am now noticing, around $2,970, which given the RSI, is likely to come sooner than later.
JP Morgan
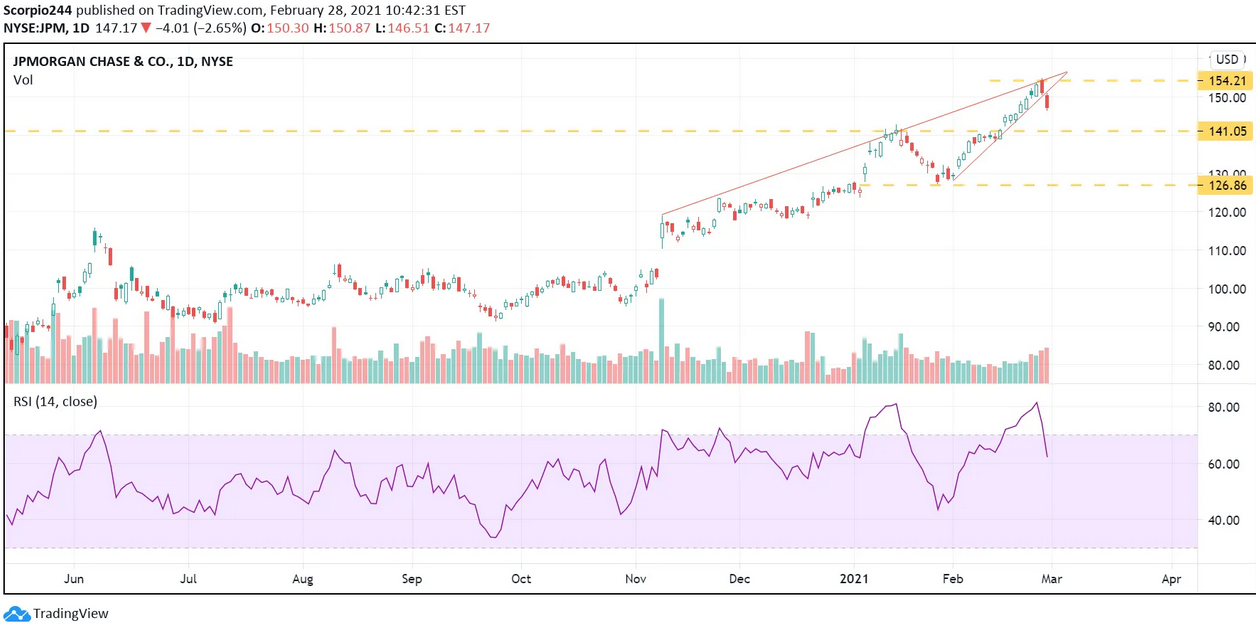
I didn’t get JPMorgan's (NYSE:JPM) call correct at first, but maybe I can I correct that. Originally, I thought JPMorgan’s stock was likely to fail at resistance around $141. However, it continued to push higher as rates rose. But they stalled out at $154 after becoming extremely overbought. But the uptrend is broken. I think it will fall back to $141.
Costco
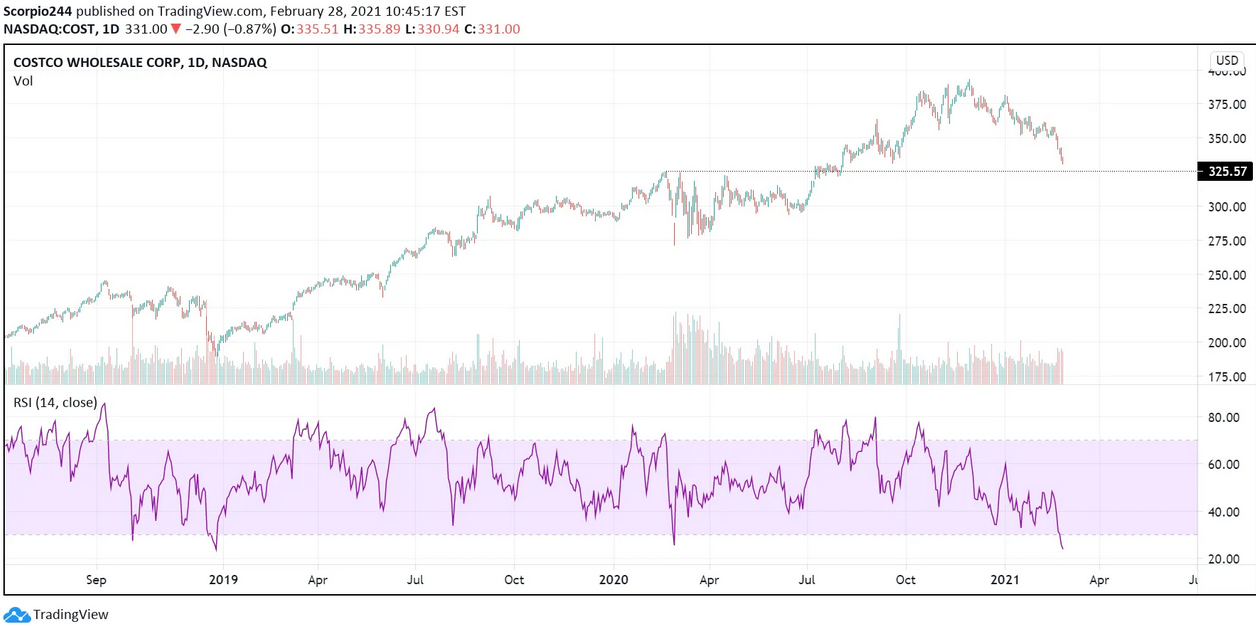
Costco (NASDAQ:COST) has given back nearly all of its post-pandemic gains and should find support around $325. The stock is extremely oversold, but I’m not sure if the longer-term trend lower in the RSI is over yet.
P&G
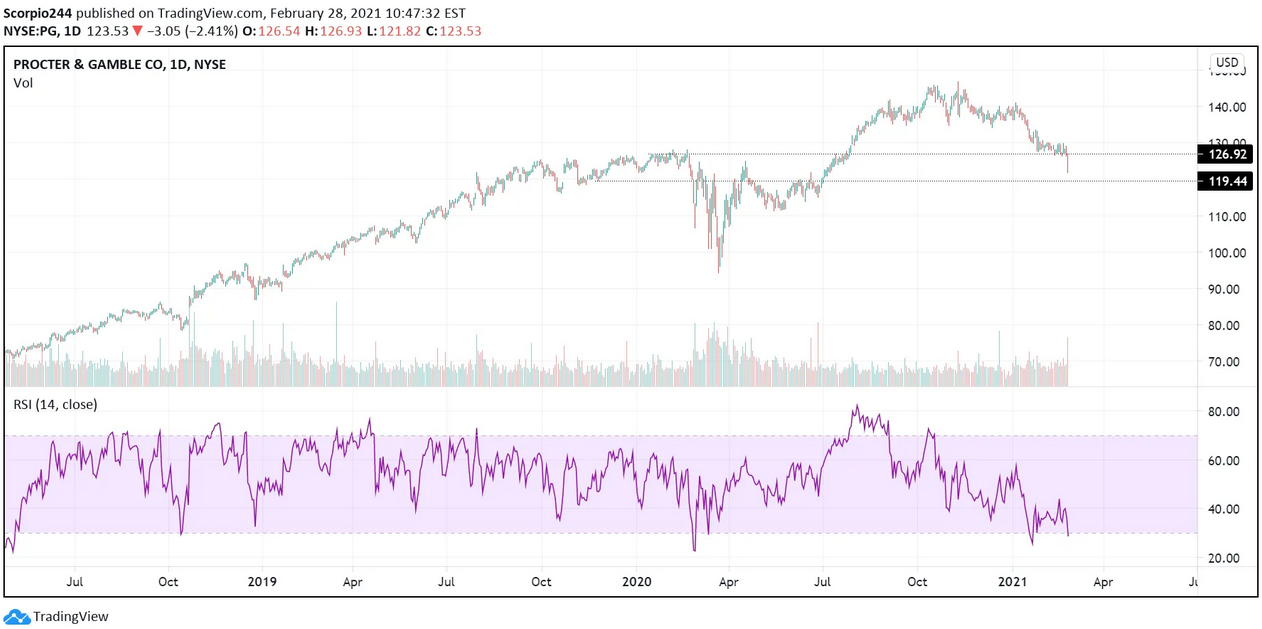
Procter & Gamble (NYSE:PG) has already fallen below its February 2020 highs, and may still have some further to fall, perhaps to around $119.75.
Adobe
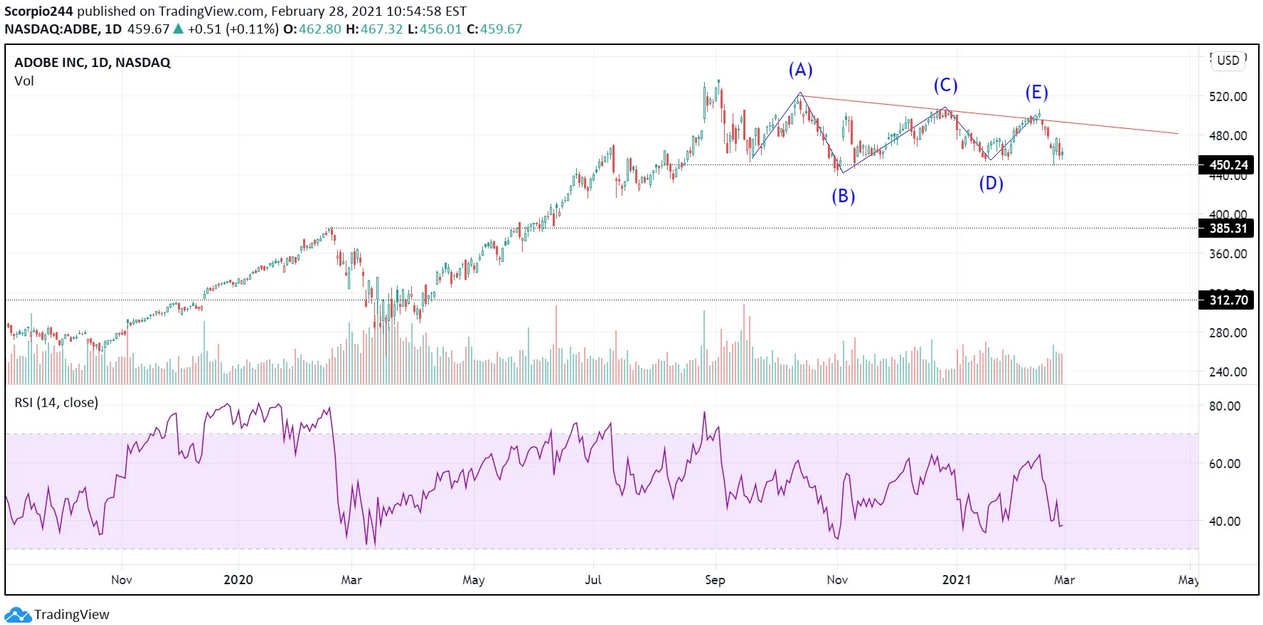
Adobe (NASDAQ:ADBE) is testing key support at $450, and a break of that level of support likely starts a big drop lower. There could be some support around $415, but there is also a good chance to come out of this descending triangle, and where the RSI is, that $385 may be more likely.
Tesla
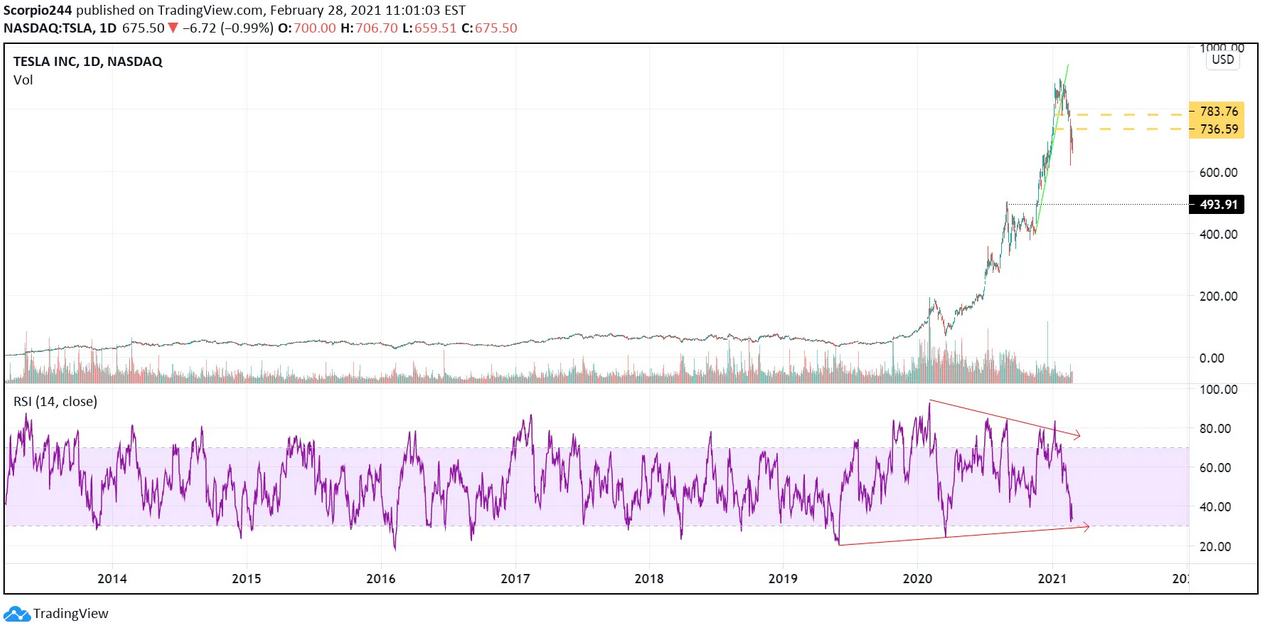
As much as it pains me to say it, Tesla (NASDAQ:TSLA) could be heading back to $500. There have been a lot of broken levels. I’m not saying it happens this week, but it certainly could over the next several weeks. I have owned the stock since the summer of 2014.
Anyway, have a great week.
