
The outlook for the US economy has hit a rough patch lately, according to some indicators, but you wouldn’t know it from the weekly updates on jobless claims. This leading indicator continues to paint an upbeat profile for the labor market, which suggests that whatever’s weighing on the broad macro trend will soon fade.
New filings for unemployment benefits fell 12,000 to a seasonally adjusted 267,000 last week—close to a 15-year low. The weekly fluctuations are noisy, but the more-reliable year-over-year trend remains solidly bullish, with new claims falling a solid 14.7% vs. the year-earlier level.
The message, of course, is that labor market remains poised for a healthy rate of growth in near-term future. The economy, as a result, will continue to draw on this critical source of support—support that’s likely to keep business-cycle risk low, as it was in May.
Common sense suggests that low/falling jobless claims equate with a strong pace of job creation. No wonder, then, that private-sector payrolls have been increasing at a strong rate—a bit more than 2.5% for the year through May, which is slightly higher than the peak in the expansionary period before the Great Recession.
The ongoing decline in jobless claims suggests that payrolls will maintain the positive momentum for the foreseeable future. If and when the labor market stumbles, an early warning will likely show up via rising jobless claims. But there’s no sign of trouble these days, which implies that a bullish trend will prevail for payrolls.
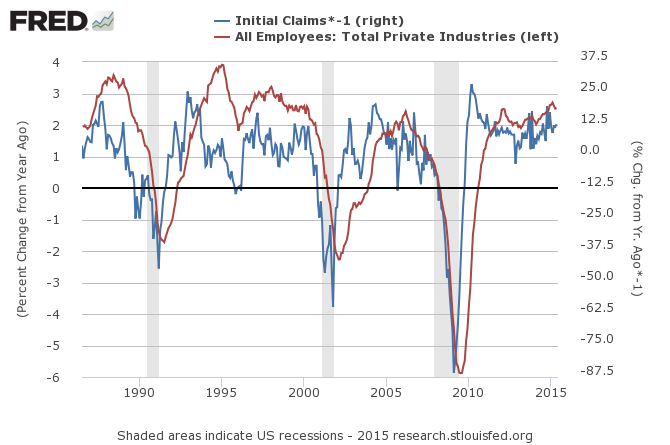
Let’s quantify the relationship with a linear-regression model. Because claims are reported weekly, a bit of tweaking is required for comparison with the monthly numbers on payrolls. To filter out most of the short-term noise in both data sets, we’ll focus on year-over-year percentage changes. One more adjustment: we’ll use the inverse change in claims for an apples-to-apples comparison with payrolls. Crunching the data in R reveals a comparatively strong relationship. Note the small p-values, which suggest that the connection between these two data sets isn’t random.
Residuals: Min 1Q Median 3Q Max -7.0205 -1.0041 0.1335 1.2863 4.0100 Coefficients: Estimate Std. Error t value Pr(>|t|) (Intercept) 1.814835 0.082087 22.11
We’re only halfway through June and so the claims figures remain a work in progress for this month. But let’s ignore that glitch for the moment and use the month-to-date numbers to forecast private payrolls, based on the historical relationship for annual changes since 1968. Not surprisingly, the current data on claims is predicting that the roughly 2.5% year-over-year rise in payrolls of late will endure.

Dismal scientists are inclined to agree. “The lower-than-expected print for initial claims, particularly relative to the May survey week, suggests labor markets have continued to strengthen through mid-June,” Barclays (LONDON:BARC) Research economist Jesse Hurwitz advised in a note to clients.