Get 40% Off
🚀 AI-picked stocks soar in May. PRFT is +55%—in just 16 days! Don’t miss June’s top picks.Unlock full list

JPY And CAD Real Volume See Opposite Extremes

Published 08/20/2015, 02:16 AM
Updated 07/09/2023, 06:31 AM
USD/JPY
-
USD/CAD
-
DX
-

Talking Points:
  • USD/JPY real volume hit levels comparable to holiday conditions or quiet last seen in 2012 recently.
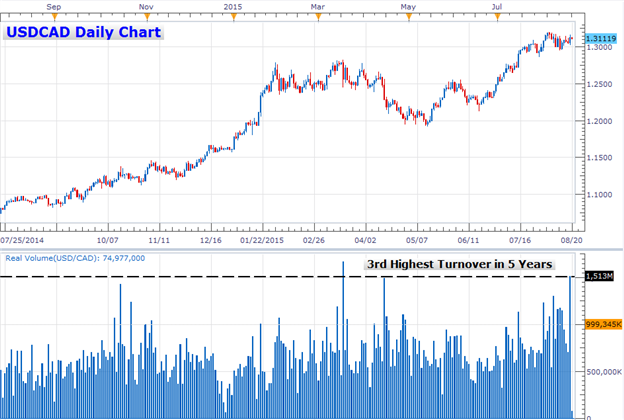
  • USD/CAD real volume is climbing with a surge Wednesday and a 20-day moving average at its highest level since 2010.
  • Fundamentals through relative monetary policy may help explain trading bias.

Volume figures behind some of the majors are offering contrasting signals for activity in the more liquid areas of the market. Nowhere was the discrepancy as large as between USD/JPY and USD/CAD.

Looking at the USD/JPY, we have seen activity near the start of this week match levels of turnover seen during holidays. Excluding those exceptional periods of inactivity, we haven’t seen regular volume levels from USD/JPY of this magnitude since 2012 — before speculation around the BoJ’s stimulus program began. Looking to the 20-day moving average (the average for a trading month), activity levels have similarly dropped to the lowest level the indicator produced since September 2012. It should be noted that over the past 2 months, volume typically spiked above the moving average when the USD/JPY fell.

The USD/CAD reveals a different story. Similar to the USD/JPY, the loonie has been in a long-term climb from its low in July 2011. Since then, the Canadian dollar has lost more than 40 percent of its value versus its US counterpart. Unlike the USD/JPY, real volume has been on the rise recently. The latest pop in volume was its highest level since March 19, 2015 — and the third highest turnover day in the five years of historical data available. The 20-day average currently stands at a record high.

Seasonal factors and fundamentals may help explain why average volume has declined for the USD/JPY and increased for the USD/CAD. The Bank of Japan has been on autopilot for its QQE program showing no signs of tapering or implementing more stimulus. At the same time, the yen crosses have shown a strong correlation to ‘risk trends’ which has been sidelined by summer trading conditions. Meanwhile, in its July 15 interest rate decision, the Bank of Canada cut its benchmark lending rate and downgraded its outlook on economic growth.

The FXCM Real Volume indicator is a tool traders can incorporate into their own strategies. The application, on Tradestation II, reveals the number of positions taken for a pair. A change in volume alongside a change in price can indicate shifting levels of conviction to compliment direction. Below, a 20-day moving average has been added to the charts in order to see the underlying trend.
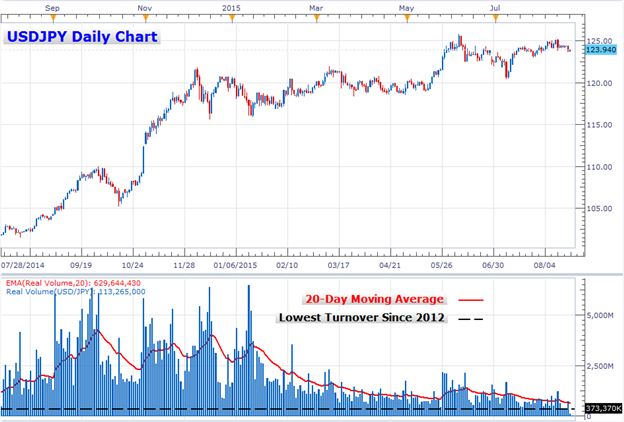
USD/JPY Daily Chart

USD/CAD Daily Chart

Original post

Latest comments

Loading next article…
Risk Disclosure: Trading in financial instruments and/or cryptocurrencies involves high risks including the risk of losing some, or all, of your investment amount, and may not be suitable for all investors. Prices of cryptocurrencies are extremely volatile and may be affected by external factors such as financial, regulatory or political events. Trading on margin increases the financial risks.
Before deciding to trade in financial instrument or cryptocurrencies you should be fully informed of the risks and costs associated with trading the financial markets, carefully consider your investment objectives, level of experience, and risk appetite, and seek professional advice where needed.
Fusion Media would like to remind you that the data contained in this website is not necessarily real-time nor accurate. The data and prices on the website are not necessarily provided by any market or exchange, but may be provided by market makers, and so prices may not be accurate and may differ from the actual price at any given market, meaning prices are indicative and not appropriate for trading purposes. Fusion Media and any provider of the data contained in this website will not accept liability for any loss or damage as a result of your trading, or your reliance on the information contained within this website.
It is prohibited to use, store, reproduce, display, modify, transmit or distribute the data contained in this website without the explicit prior written permission of Fusion Media and/or the data provider. All intellectual property rights are reserved by the providers and/or the exchange providing the data contained in this website.
Fusion Media may be compensated by the advertisers that appear on the website, based on your interaction with the advertisements or advertisers.
© 2007-2024 - Fusion Media Limited. All Rights Reserved.