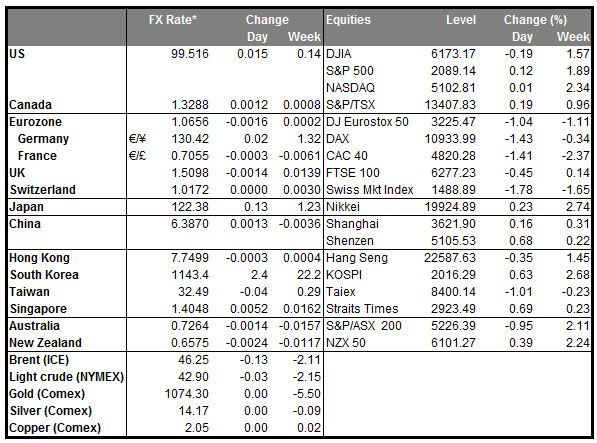
• Japan avoids technical recession Japan’s economy dodged a technical recession, defined as two consecutive quarters of negative growth, with the Q3 growth rate revised up to +0.3% qoq. The main contributor to positive growth was capital expenditure, a success widely attributed to Shinzo Abe’s government policies, pressuring companies to invest their record profits. However, concerns about the economy being in a standstill remain, with the government growth target being far from reached. Given weak household spending and exports thus far in Q4, this could put policymakers under pressure to introduce additional stimulus in order to accelerate growth.
• Chinese November exports weaker than expected, but imports decline eases China’s trade performance remained weak in November. The trade surplus expanded, but only because imports fell at a faster pace than exports. Imports fell for the 13th consecutive month, but by less than expected, while exports declined by more than expected. This was the 5th straight month exports fell. The weak performance is expected add to evidence that the Chinese economy will print its slowest expansion in Q4 for a quarter of a century. This could hurt AUD and NZD.
• Today’s highlights: During the European day, Eurozone’s final Q3 GDP is forecast to confirm the preliminary estimate and to show that Eurozone’s economy expanded by only 0.3% qoq. Therefore, the market reaction could be minimal at this release, unless we have a huge revision.
• From the UK, we get industrial production for October. Expectations are for the industrial output to have risen 0.1% mom, a rebound from September’s 0.2% decline. Given that the construction and manufacturing PMIs for the same month were encouraging, although they disappointed the following month, we see the likelihood for a strong industrial production figure as well. This could support the pound, at least temporarily.
• In Canada, housing starts for November and building permits for October are due to be released. The forecast is for housing starts to have declined marginally in November, while building permits are expected to have increased in October after falling for two consecutive months, which could boost CAD a bit.
• In the US, the Job Opening and Labor Turnover Survey (JOLTS) report for October is due out and the forecast is for a marginal decline in the number of job openings. This survey will also report the “quit rate,” which measures workers who voluntarily resign, and is a closely watched indicator of how strong the job market is. Additionally, we receive the NFIB Business Optimism Index for October. Even though this indicator is not a major market mover, it is worth watching because of the Fed’s emphasis on employment. Small businesses employ the majority of people in the US. Following the better-than-expected NFP figure for November and the astonishing print in October, this indicator could attract more attention than usual going into next week’s FOMC meeting.
• We have only one speaker for the day: Bank of Canada Governor Stephen Poloz.
The Market
EUR/USD rebounds from 1.0800
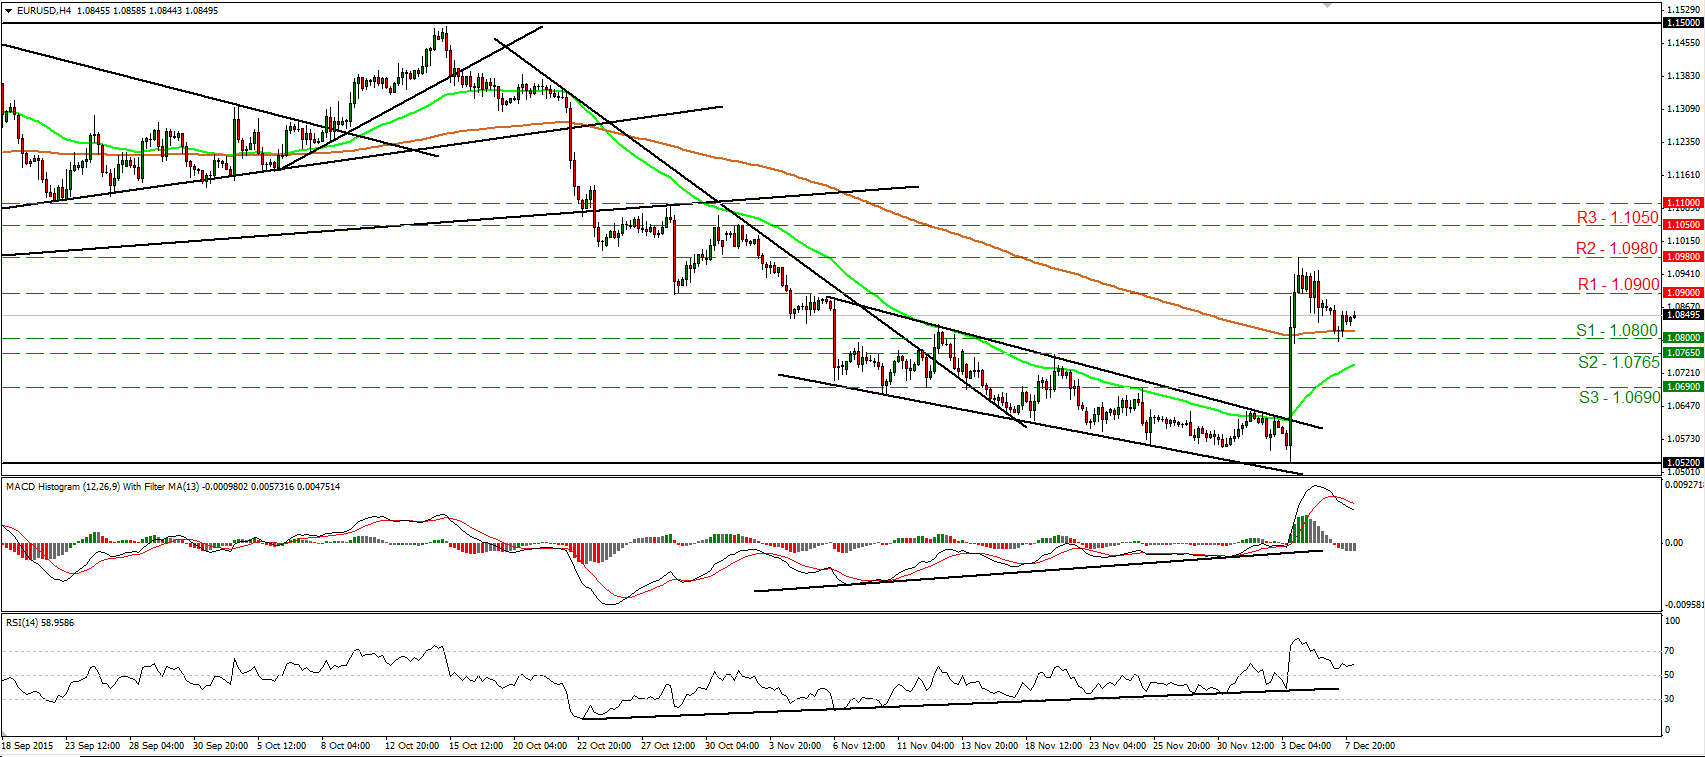
• EUR/USD traded lower on Monday, but hit support fractionally below 1.0800 (S1) and then it rebounded to trade virtually unchanged. The astonishing 500-pip rally on Thursday has turned the short-term picture positive in my view and as a result, I would expect a clear move above 1.0900 (R1) to set the stage for another test near the 1.0980 (R2) area. However, taking a look at our short-term oscillators, I see signs that the pair could retreat a bit more before and if the bulls decide to shoot again, perhaps for another test near 1.0800 (S1) or 1.0765 (S2). The RSI edged lower after it exited its overbought territory, while the MACD, although positive, has topped and fallen below its signal line. Switching to the daily chart, I see that the pair remains above the 1.0800 (S1) barrier, the lower bound of the range it had been trading from the last days of April until the 6th of November. As a result, although I believe the short-term picture has turned positive, I prefer to take a neutral stance as far as the overall outlook of EUR/USD is concerned.
• Support: 1.0800 (S1), 1.0765 (S2), 1.0690 (S3)
• Resistance: 1.0900 (R1), 1.0980 (R2), 1.1050 (R3)
AUD/USD plunges
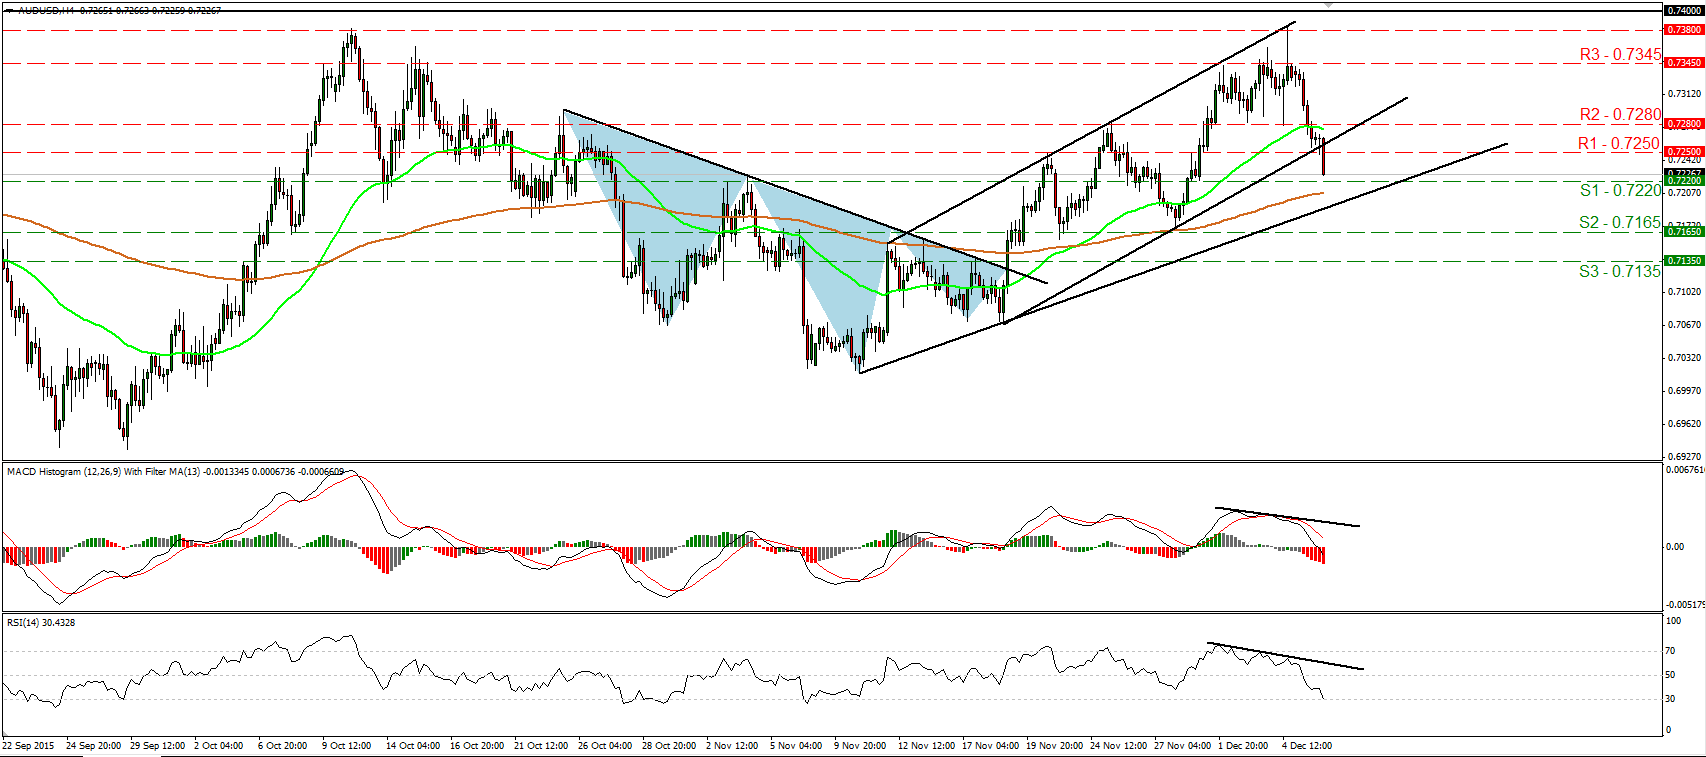
• AUD/USD plunged yesterday, falling below the upside support line taken from the low of the 18th of November. The plunge confirmed the negative divergence between our oscillators and the price action and has turned the short-term outlook negative in my view. The rate is now headed towards the 0.7220 (S1) support line, where a dip is likely to challenge the upside line taken from the low of the 10th of November or our next support barrier of 0.7165 (S2). Our momentum studies detect strong downside speed and support that the pair could continue lower, at least in the short run. The RSI continued sliding and now looks ready to move below 30, while the MACD, already below its trigger line, has just turned negative. Switching to the daily chart, I see that AUD/USD still oscillates between 0.6900 and 0.7400 since mid-July. As a result, although I believe that the short-term bias has turned negative, I would hold a flat stance for now as far as the broader trend is concerned.
• Support: 0.7220 (S1), 0.7165 (S2), 0.7135 (S3)
• Resistance: 0.7250 (R1), 0.7280 (R2), 0.7345 (R3)
GBP/JPY slides after hitting resistance at 186.40
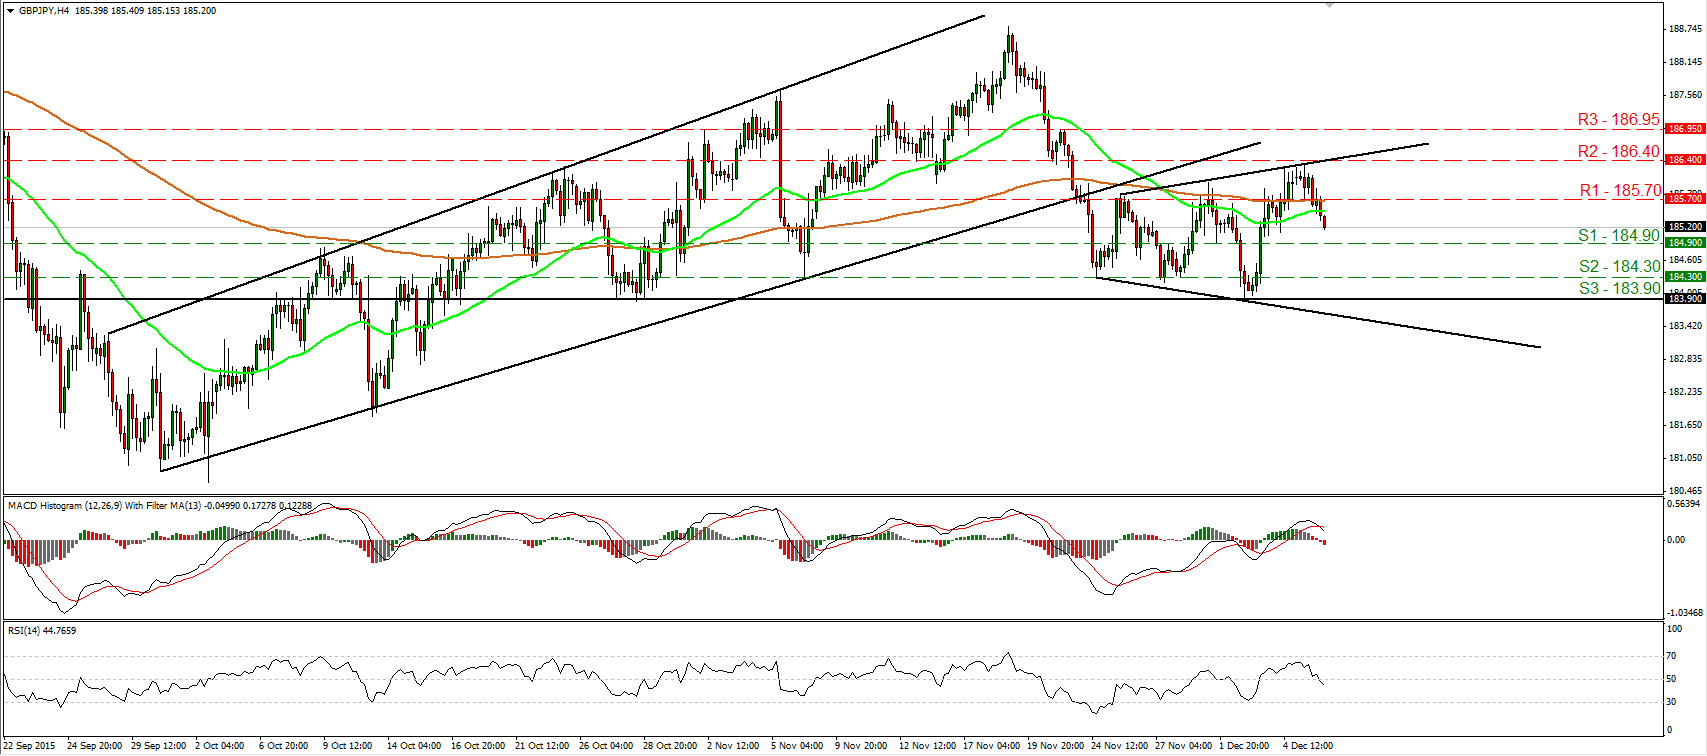
• GBP/JPY tumbled after it hit resistance near the 186.40 (S1) line and fell below the support (now turned into resistance) area of 185.70 (R1). The pair seems to be trading within a broadening formation, and since it slid after it hit the upper line of the pattern, I would expect the decline to continue. I believe that sellers are poised to challenge the 184.90 (S1) support line, where a break is likely to pave the way for the 184.30 (S2) zone. This is also supported by our momentum studies. The RSI turned down and fell back below its 50 line, while the MACD, although positive, has topped and fallen below its trigger line. On the daily chart, as long as the pair is trading within a wide sideways range between the 180.50 and 188.50 zones, I would maintain my flat stance as far as the broader trend is concerned.
• Support: 184.90 (S1), 184.30 (S2), 183.90 (S3)
• Resistance: 185.70 (R1), 186.40 (R2), 186.95 (R3)
Gold rebounds from near 1065
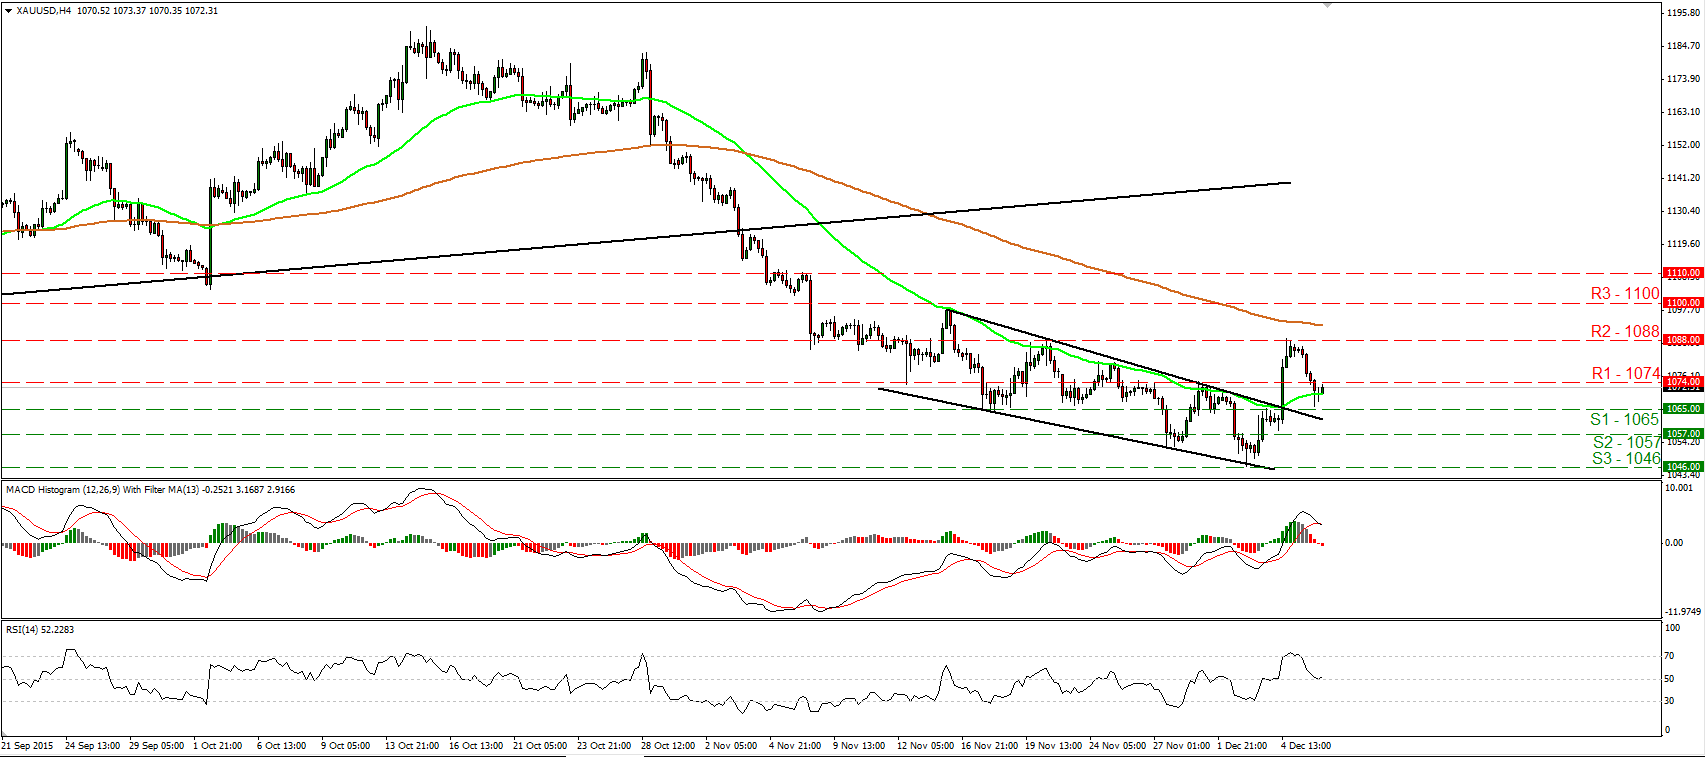
• Gold traded lower on Monday, breaking below the support (now turned into resistance) of 1074 (R1). However the decline was stopped fractionally above the 1065 (S1) line and the downtrend line taken from the peak of the 16th of November. The break above that trend line on Friday has turned the near-term picture positive in my view and therefore, I would expect a move back above 1074 (R1) to confirm a higher low near 1065 (S1) and to aim for another test at 1088 (R2). Our short-term oscillators support somewhat the notion. The RSI hit support at its 50 line and turned up, while the MACD, already positive, shows signs that it could start bottoming. On the daily chart, I see that the plunge below the upside support line taken from the low of the 20th of July has shifted the medium-term outlook to the downside. As a result, I believe that the metal is poised to continue its down road in the foreseeable future and I would treat Friday’s rally or any extensions of it as a corrective phase for now.
• Support: 1065 (S1), 1057 (S2), 1046 (S3)
• Resistance: 1074 (R1), 1088 (R2), 1100 (R3)
DAX futures pull back and hit support near 10850
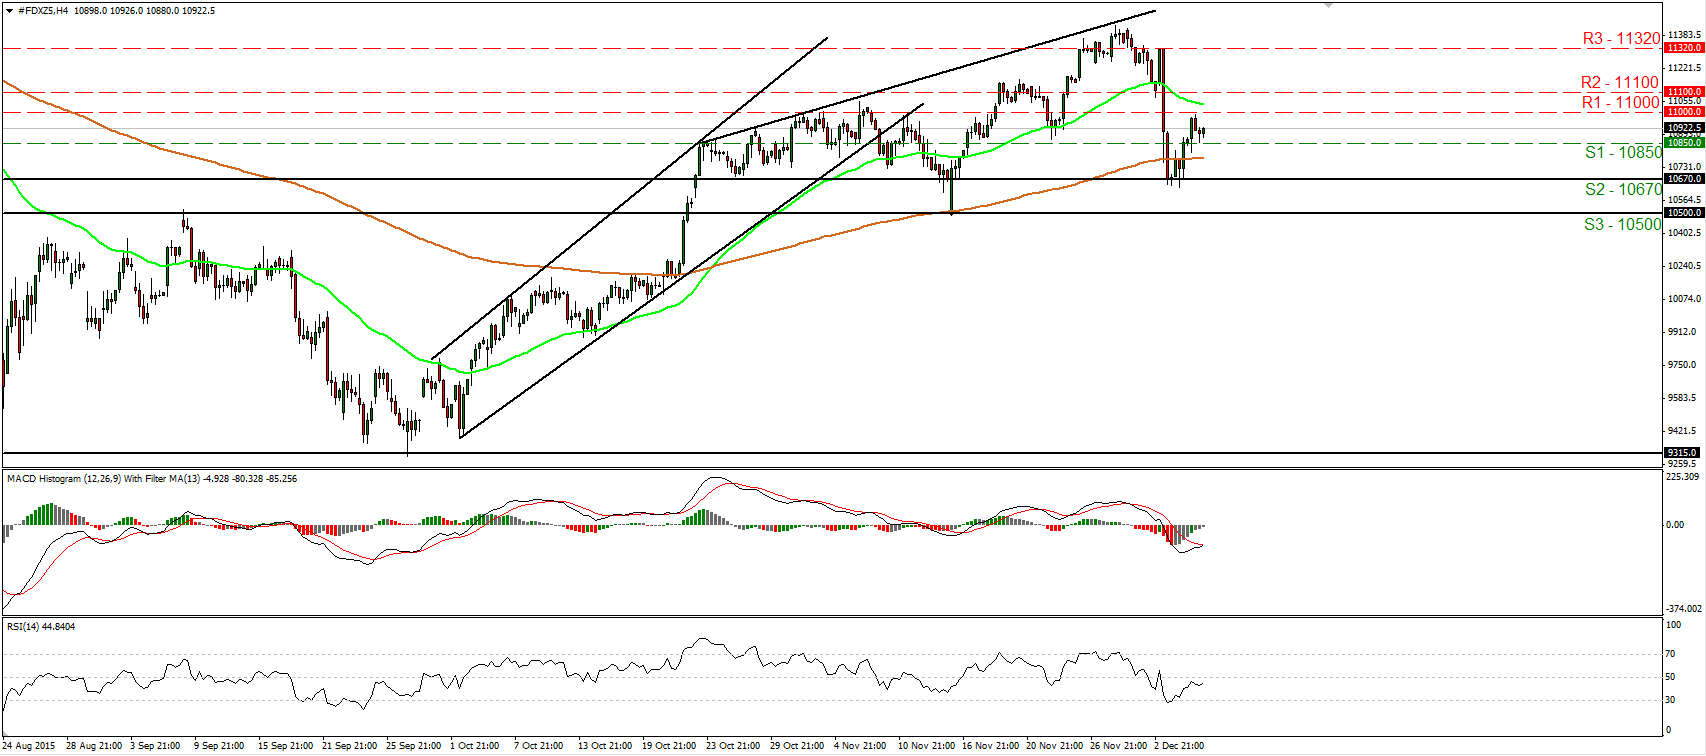
• DAX futures traded slightly lower yesterday after they hit resistance near the psychological zone of 11000 (R1). However, the slide was halted by the 10850 (S1) line and then the index rebounded somewhat. In my view, the rebound from the key support zone of 10670 (S2) confirmed that Thursday’s tumble was just a corrective move and kept the short-term outlook cautiously positive. I believe that the bulls are likely to continue pushing the price higher, and if they manage to overcome the 11000 (R1) zone, they are likely to challenge the next resistance at 11100 (R2). A break above 11100 (R2) is needed though to pull the trigger for larger bullish extensions, perhaps towards the 11320 (R3) area, marked by Thursday’s peak. Our short-term oscillators corroborate my view. The RSI rebounded from its 30 line and could move above 50 soon, while the MACD has bottomed and looks able to cross above its trigger line. On the daily chart, the break above the psychological zone of 10500 (S3) on the 22nd of October signalled the completion of a double bottom formation. What is more, the rebound on the 16th of November from that psychological area adds to my view that the medium-term path remains positive.
• Support: 10850 (S1), 10670 (S2), 10500 (S3)
• Resistance: 11000 (R1), 11100 (R2), 11320 (R3)

