
Forex News and Events
Japan’s 3Q GDP increased
Against all odds, Japan’s gross domestic product rose at a 1% annualized rate vs 0.2% expected and way above the preliminary reading of -0.8%. As a result, Japan is avoiding technical recession, which consists of two consecutive quarters of economic contraction. It turns out that corporate capital spending, as well as consumption were better-than-expected and drove GDP higher.
The major information out of those prints is that the GDP deflator was released and still remains at a decent level, even though below last quarter, at 1.8% y/y vs 2% y/y. It clearly shows that there is a growing inflation momentum in Japan. This could have some consequences as this now leaves some room for the Bank of Japan. However, we do not believe that more stimulus would be added at the next BoJ meeting.
For the time being, all eyes will then be focused on the Tankan report, due out next Monday. Yet, we should not forget Japan's massive debt or aging population. Inflation is the key and would help to reduce the burden of debt.
RBNZ to Cut 25bp…Yet NZD to rally
Data released from New Zealand indicated that manufacturing activity 3Q surged 4.2% q/q following an upwardly revised 1.0% increase in 2Q. Despite the positive backwards-looking result we continue to anticipate the RBNZ to cut interest rates by 25bp to 2.50% tomorrow. The rational for this dovish outlook when some central banks are retreating from their endless easing stance is based on four primary reasons. Commodity prices continued to drag on New Zealand’s economic activity. Milk prices continued to fall (over double digits since the last meeting), with expectations that demand forecasts will be cut. The broader commodity complex remains under pressure, while oil prices are slipping below $40 indicating that deflationary pressures will increase. On a trade-weighted-basis the NZD remains over 5% overvalued and with the Fed nearly completely priced in the likelihood of significant USD strength is slim. Governor Wheeler cannot rely on the Chair Yellen to do his dirty work and debase the NZD. Domestically, the housing markets show clear signals of deceleration. House sales y/y has fallen sharply in October having peaked in August 2015. While exports have come in meaningfully below expectations, erosion in labor markets over the past few months cannot be ignored. Finally, China, the engine of regional growth is failing to make a solid recovery. Data released today indicates that China trade performance remains weak in November as exports sunk by -6.8% and imports contracted -8.7%. The lack of encouraging signals from China suggests the regional recovery aspirations look frail. Currently the NZD OIS markets is pricing in a 60% chance of a cut. However, IMM data indicated the NZD has been heavily accumulating, suggesting that the FX market is over-positioned for a dovish outcome. The RBNZ have indicated that the threshold for additional easing is high, should the verbiage sound less-dovish (a la Draghi) or indicate that after this cut an extended pause, we could see a decent NZD recovery rally.
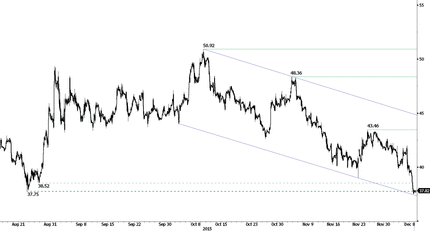
Crude Oil - Crashing

The Risk Today
EUR/USD is moving along the downtrend channel. Hourly support lies at 1.0524 (03/12/2015 low). Hourly resistance can be found at 1.0981 (03/12/2015 high). Expected to show further consolidation. In the longer term, the technical structure favours a bearish bias as long as resistance holds. Key resistance is located region at 1.1453 (range high) and 1.1640 (11/11/2005 low) is likely to cap any price appreciation. The current technical deteriorations favours a gradual decline towards the support at 1.0504 (21/03/2003 low).
GBP/USD's downside momentum remain lively. The pair has weakened for the second day in a row. Hourly resistance is given at 1.5336 (19/11/2015 high). Strong resistance can be found at 1.5529 (22/09/2015 high). Expected to show further weakness. The long-term technical pattern is negative and favours a further decline towards the key support at 1.5089 , as long as prices remain below the resistance at 1.5340/64 (04/11/2015 low see also the 200 day moving average). However, the general oversold conditions and the recent pick-up in buying interest pave the way for a rebound.
USD/JPY remains between hourly resistance at 123.76 (18/11/2015 high) and hourly support at 122.23 (16/11/2015 low). Expected to bounce back from support at 122.23. A long-term bullish bias is favored as long as the strong support at 115.57 (16/12/2014 low) holds. A gradual rise towards the major resistance at 135.15 (01/02/2002 high) is favored. A key support can be found at 116.18 (24/08/2015 low).
USD/CHF is now consolidating after last week's sharp decline. Hourly support is given at 0.9876 (27/10/2015 low) while hourly resistance is given at 1.0328 (27/11/2015 high). Expected to show further consolidation above 1.0000. In the long-term, the pair has broken resistance at 0.9448 and key resistance at 0.9957 suggesting further uptrend. Key support can be found 0.8986 (30/01/2015 low). As long as these levels hold, a long term bullish bias is favoured.
