Early in 2012 Scott’s Investments added a daily Ivy Portfolio spreadsheet. This tool uses Google Documents and Yahoo Finance to track the 10 month moving average signals for two of the portfolios listed in Mebane Faber’s book The Ivy Portfolio: How to Invest Like the Top Endowments and Avoid Bear Markets. Faber discusses 5, 10, and 20 security portfolios that have trading signals based on long-term moving averages.
The Ivy Portfolio spreadsheet tracks the 5 and 10 ETF Portfolios listed in Faber’s book. When a security is trading below its 10 month simple moving average, the position is listed as “Cash”. When the security is trading above its 10 month simple moving average the positions is listed as “Invested”.
The spreadsheet’s signals update once daily (typically in the evening) using dividend/split adjusted closing price from Yahoo Finance. The 10 month simple moving average is based on the most recent 10 months including the current month’s most recent daily closing price. Even though the signals update daily, it is not an endorsement to check signals daily. It simply gives the spreadsheet more versatility for user’s to check at their leisure.
The page also displays the percentage each ETF within the Ivy 10 and Ivy 5 Portfolio is above or below the current 10 month simple moving average, using both adjusted and unadjusted data.
If an ETF has paid a dividend or split within the past 10 months, then when comparing the adjusted/unadjusted data you will see differences in the percent an ETF is above/below the 10 month SMA. This could also potentially impact whether an ETF is above or below its 10 month SMA. Regardless of whether you prefer the adjusted or unadjusted data, it is important to remain consistent in your approach.
I do not track these portfolios as hypothetical portfolios like I do with other portfolios on the site. However, I will periodically post backtest results on the strategy. Below are updated backtest results for the Ivy Portfolio using ETFReplay.com.
ETF Replay has added some new features including the ability to use mutual funds as benchmarks. Bench-marking against a balance fund such as the Vanguard Balanced Fund (VBINX) provides a more accurate assessment of a strategy’s performance against a mixed stock/bond asset allocation strategy. Thus, the tests below are compared to the performance of VBINX instead of the benchmark I have used in the past, the SPDR S&P 500 ETF (SPY).
Personal Capital’s free financial software helps you see all of your wealth in one place.
www.personalcapital.com
The backtest results for the Ivy 5 Portfolio since 2007 and 10 month simple moving average with a monthly update are charted below. For the backtests, iShares Barclays Aggregate Bond (AGG) was used in lieu of BND and iShares MSCI EAFE (EFA) was used in lieu of VEU because they have longer trading histories: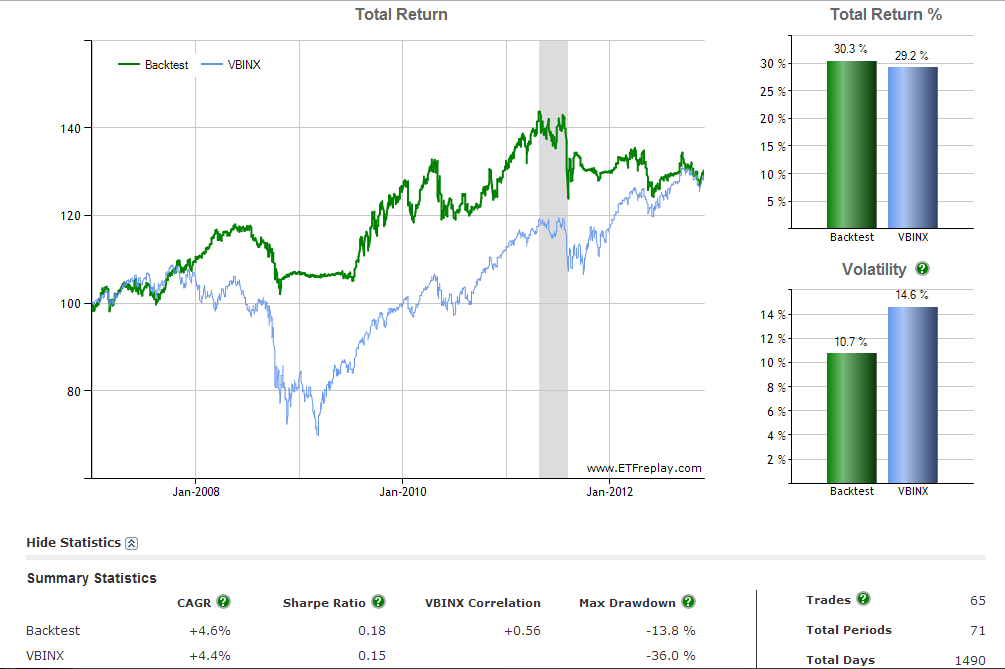
The Ivy 10 Portfolio, using a 10 month moving average and updated monthly has performed as follows since 2008 and is compared to VBINX. Again, AGG and EFA were used in the backtests. A starting date of 2008 was used in the first chart because only 8 of the 10 ETFs in the list were available at the start of 2007. The second charts shows the performance since 2007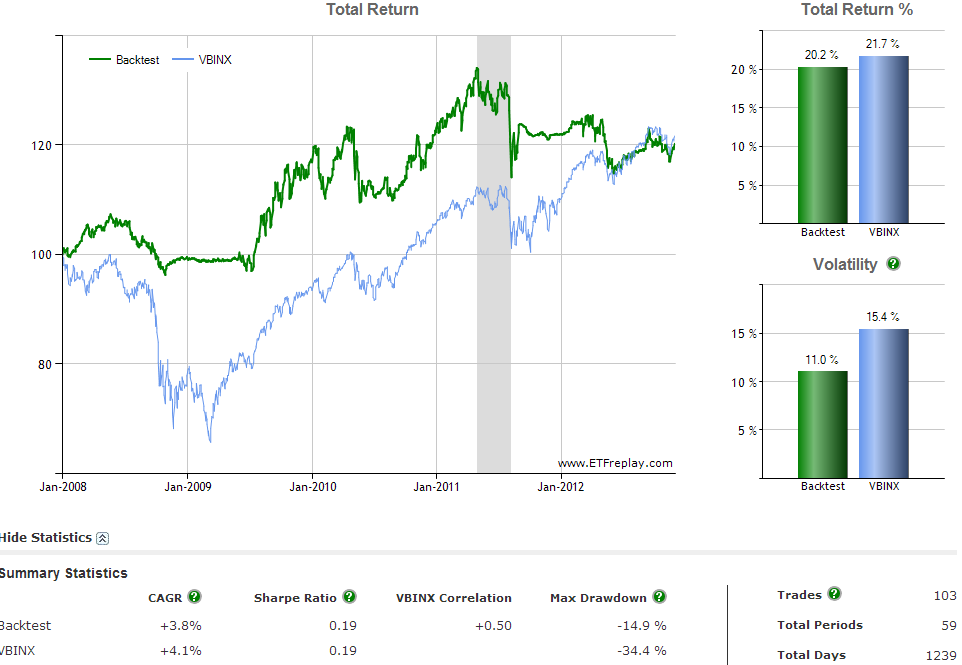
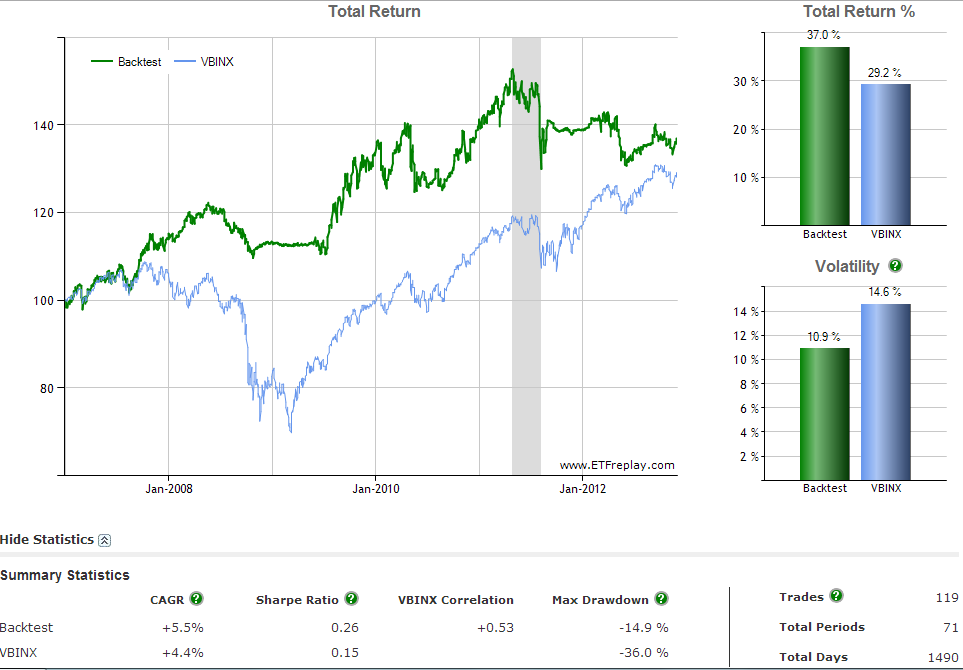
The strategy’s strength is avoiding significant drawdowns during periods of market turbulence, such as 2008. During periods of strong uptrending equity markets it has the potential to under-perform a benchmark like VBINX or SPY. ”Choppy” markets, in which markets are trend-less can also reduce the strategy’s returns as securities bounce above and below long-term moving averages without establishing a trend.
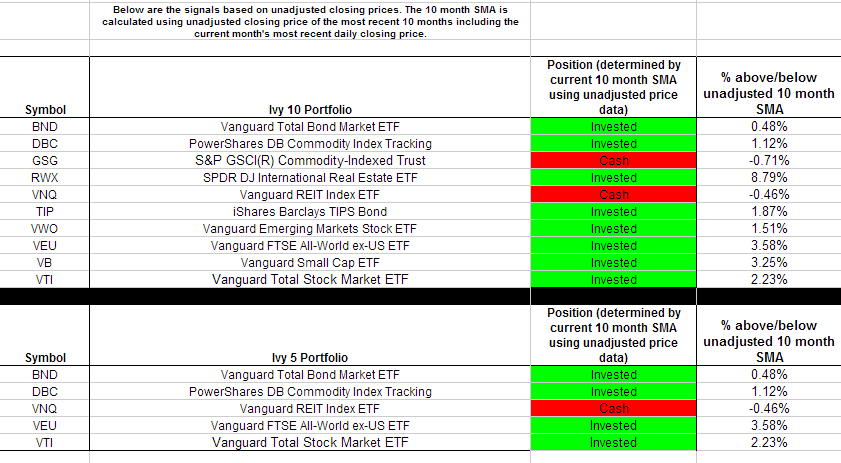
The current signals based on November 30th’s closing prices are below. International equities and international real estate are the strongest sector in terms of their percent above their 10 month moving average. Commodities and US REITs are the weakest sectors.
The first table is based on adjusted historical data and the second table is based on unadjusted price data: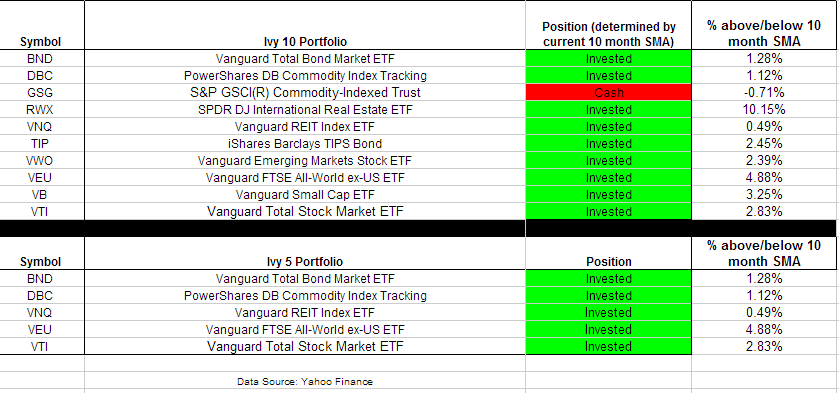
Disclaimer: Stock Loon LLC, Scott's Investments and its author is not a financial adviser. Stock Loon LLC, Scott's Investments and its author does not offer recommendations or personal investment advice to any specific person for any particular purpose. Please consult your own investment adviser and do your own due diligence before making any investment decisions. Please read the full disclaimer at the bottom of www.scottsinvestments.com
- English (UK)
- English (India)
- English (Canada)
- English (Australia)
- English (South Africa)
- English (Philippines)
- English (Nigeria)
- Deutsch
- Español (España)
- Español (México)
- Français
- Italiano
- Nederlands
- Português (Portugal)
- Polski
- Português (Brasil)
- Русский
- Türkçe
- العربية
- Ελληνικά
- Svenska
- Suomi
- עברית
- 日本語
- 한국어
- 简体中文
- 繁體中文
- Bahasa Indonesia
- Bahasa Melayu
- ไทย
- Tiếng Việt
- हिंदी
Ivy Portfolio For December
Published 12/02/2012, 03:02 AM
Updated 07/09/2023, 06:31 AM
Ivy Portfolio For December
3rd party Ad. Not an offer or recommendation by Investing.com. See disclosure here or
remove ads
.
Latest comments
Install Our App
Risk Disclosure: Trading in financial instruments and/or cryptocurrencies involves high risks including the risk of losing some, or all, of your investment amount, and may not be suitable for all investors. Prices of cryptocurrencies are extremely volatile and may be affected by external factors such as financial, regulatory or political events. Trading on margin increases the financial risks.
Before deciding to trade in financial instrument or cryptocurrencies you should be fully informed of the risks and costs associated with trading the financial markets, carefully consider your investment objectives, level of experience, and risk appetite, and seek professional advice where needed.
Fusion Media would like to remind you that the data contained in this website is not necessarily real-time nor accurate. The data and prices on the website are not necessarily provided by any market or exchange, but may be provided by market makers, and so prices may not be accurate and may differ from the actual price at any given market, meaning prices are indicative and not appropriate for trading purposes. Fusion Media and any provider of the data contained in this website will not accept liability for any loss or damage as a result of your trading, or your reliance on the information contained within this website.
It is prohibited to use, store, reproduce, display, modify, transmit or distribute the data contained in this website without the explicit prior written permission of Fusion Media and/or the data provider. All intellectual property rights are reserved by the providers and/or the exchange providing the data contained in this website.
Fusion Media may be compensated by the advertisers that appear on the website, based on your interaction with the advertisements or advertisers.
© 2007-2024 - Fusion Media Limited. All Rights Reserved.
