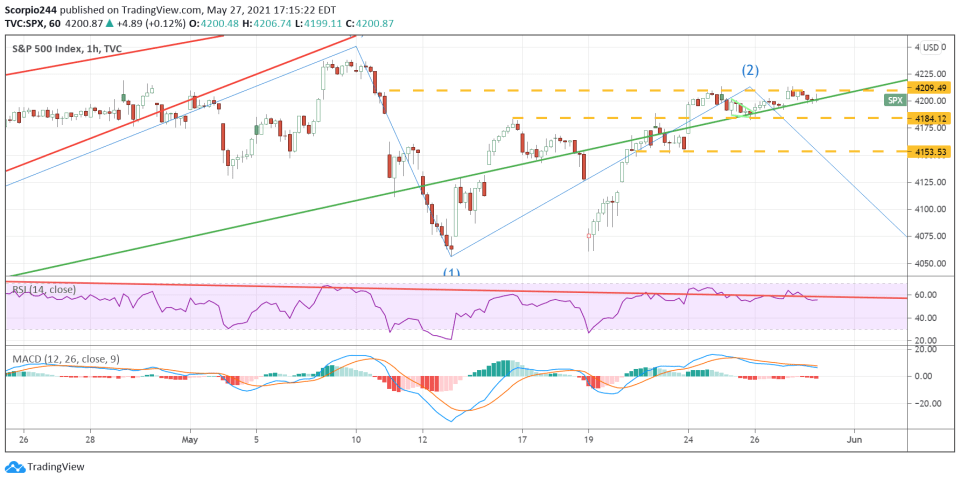
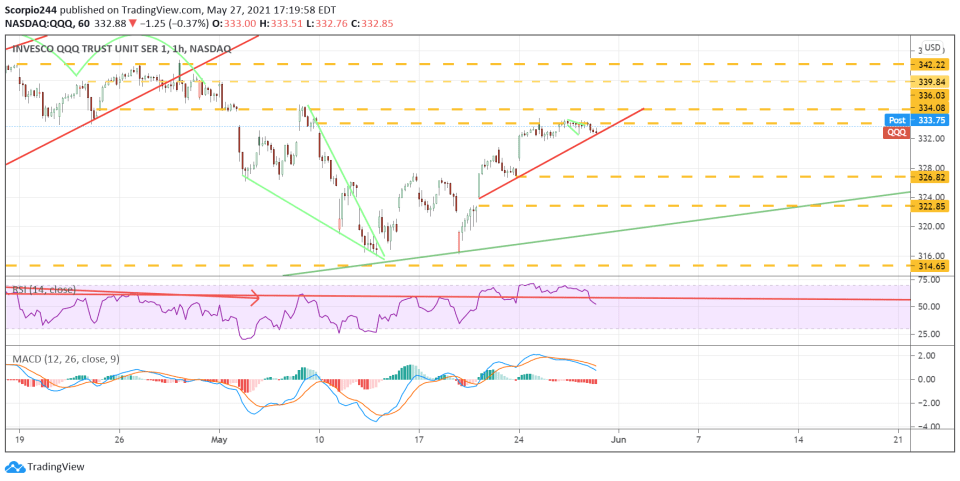
It was another boring day for stocks, with the S&P 500 finishing the day up 12 bps, while the Q)s finished the day lower by almost 40 bps. The market is waiting for the next batch of economic data, which will come on Tuesday after the long weekend. There will be some inflation data today, but the big data will be next week.
S&P 500
The S&P has been stuck around this 4,210 area for some time, which could be the making of a double top pattern. However, to confirm such a pattern, we need to see the index fall below 4,185, and that has been solid support for most of the week.
Overall, I believe we are in a long-term period of multiple compression, leading to lower equity valuation over time. I still have wave 5 completed in the first half of May and expect prices to trend lower as we move through June.
NASDAQ
The Qs continue to get rejected at the $334 level and are now sitting on an uptrend. A break of that trend line will quickly lead to a decline back to $327.
Dollar
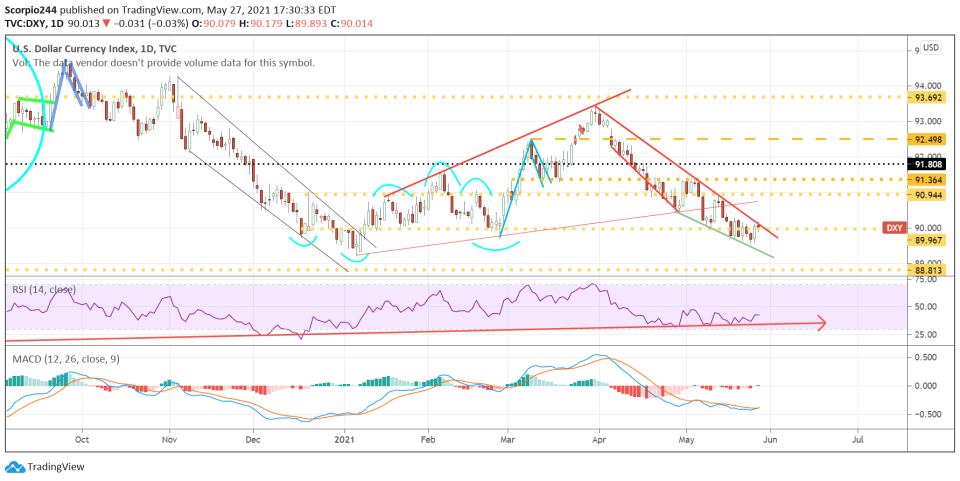
Keep an eye on the dollar; I know everyone says it’s dead and going to zero, but I don’t think that will happen. In fact, I think it is going to burst higher. There is a falling wedge pattern present, which is a bullish reversal pattern. The MACD is crossing over, and turning positive, while the RSI is firmly trending higher. A breakout will send to 91 very quickly, for starters.
JP Morgan
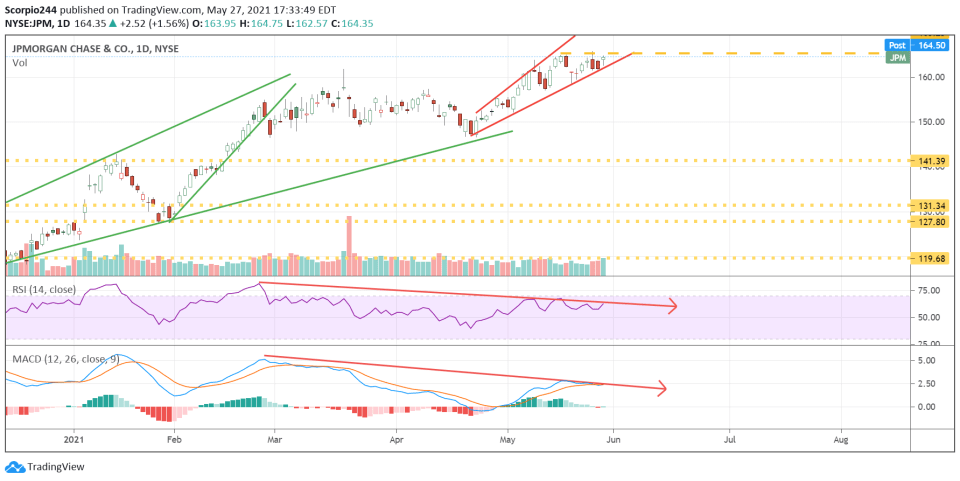
JPMorgan (NYSE:JPM) looks really tired, and the momentum indicators are confirming that. The stock has been stuck at a resistance level of around $165. There appears to be a rising broadening wedge present. Maybe it needs to come back to $156.
Nvidia
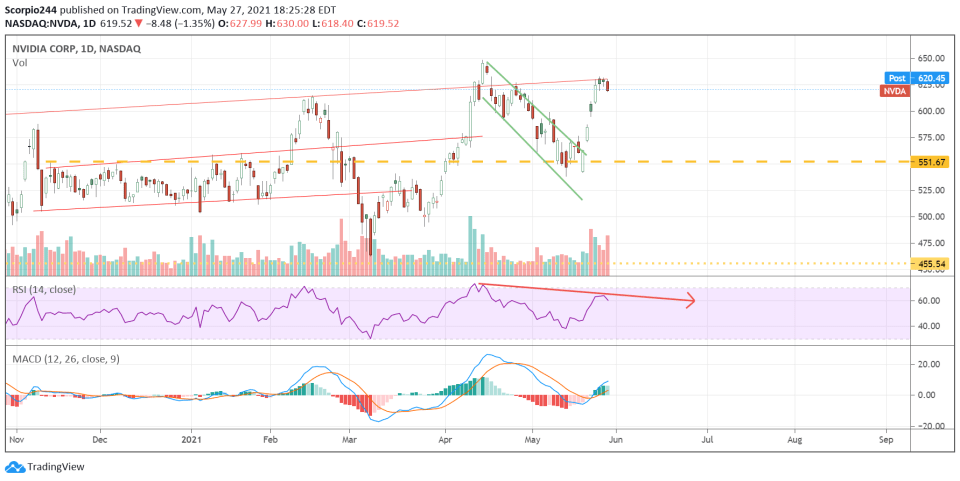
NVIDIA (NASDAQ:NVDA) fell around 1.5% despite reporting pretty solid results. Again, I think it struggles going forward because it missed the top end of the range of estimates, and in this market, you need to come in ahead on every metric and by a wide margin. In this case, they beat the mean, but they missed the top end of expectations across many categories, which isn’t good enough. It could easily fall back below $600.
Salesforce
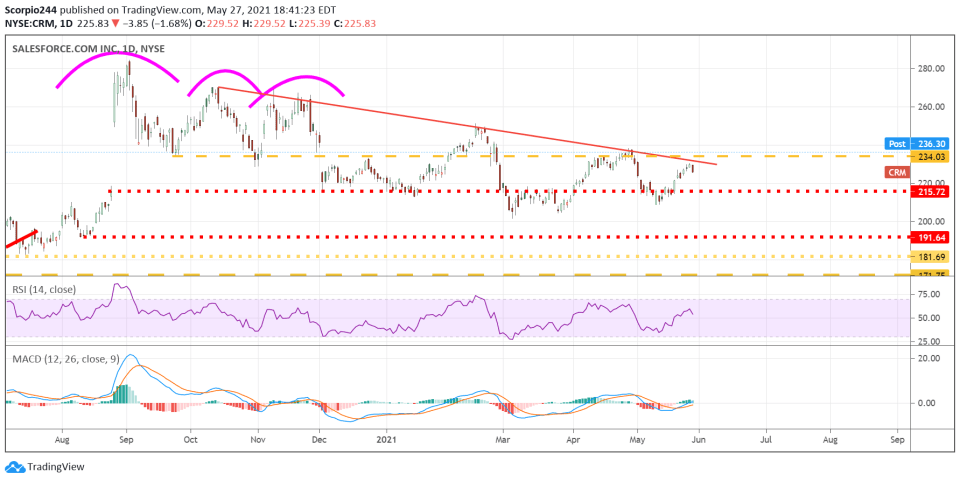
I love when Salesforce (NYSE:CRM) reports results. They reported EPS of $1.21, which was better than estimates for $0.88, while revenue came in at $5.963 billion vs. estimates for $5.9 billion. Mind you that $0.24 of their reported earnings was due to gains on strategic investments. So back that out, and they still beat, just not by nearly as much, that comes to $0.97 per share. EPS estimates at the top end of the range for $0.95. So we will see how the market feels tomorrow. For now, the market seems appeased, with the stock trading up some at $236. Today is likely to be a different story.

