WTI crude oil has surged 80% from a low of $26.19 in January. The rise was mainly fueled by one-off events such as the wildfires in Canada and attacks on oil production sites in Nigeria, which led to production being reduced by 3.5 million barrels per day in May itself, and thereby allowing the oil glut to ease.
Whilst these temporary factors have faded away and oil production has bounced back in both countries, some analysts argue that the upward price trend for crude oil will continue. However, there are some very bearish signals emerging from the oil market to suggest a different outlook. While oil has pulled back from highs in recent trading sessions, this is only the beginning of a notable swing downwards.
Technical Indicators
At its 2016 peak of $51.23, the Stochastic RSI has reached 95.16, indicating heavily overbought conditions. Thus it is natural to expect some form of pullback in prices.
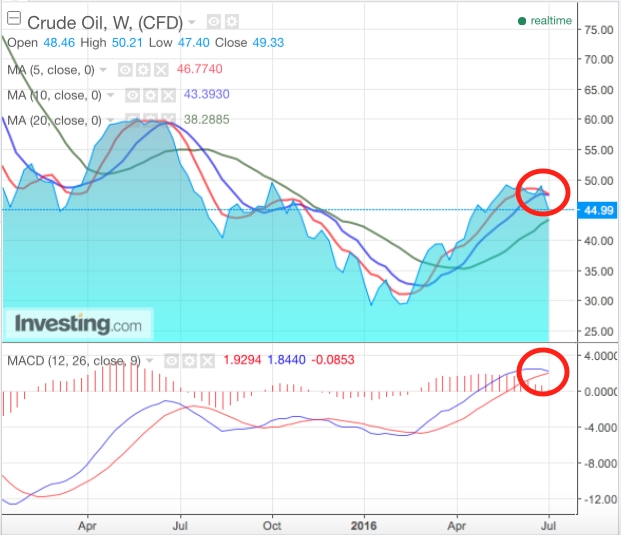
Short-term technical analysis is already signalling an initiation of a downward trend. The chart below shows how the 5-day moving average is about to cross over the 10-day moving average from above. This bearish signal is also backed up by a similar trend reflected by the MACD crossing below the signal line. Both indicators are demonstrated in the chart.
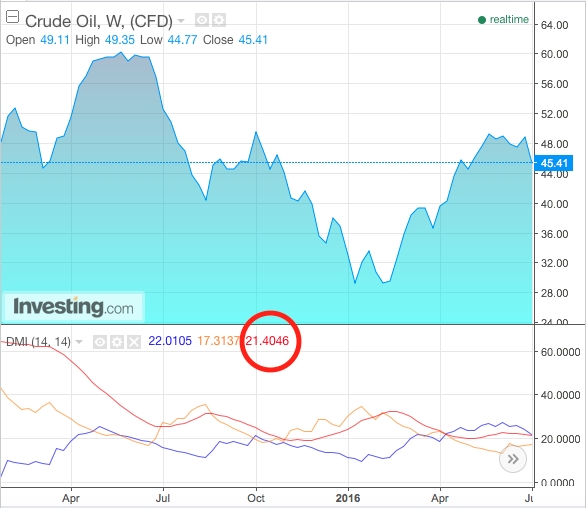
The Average Directional Index (ADX), as shown in the chart below, further reflects the downward pressure on oil. The chart demonstrates that while crude oil prices were rallying over the past 2 months, the ADX (red line) and Positive Directional Index (blue line) barely picked up. In fact, the ADX is currently at 21.40. A reading below 25 indicates a weak trend. This manifests a very bearish sign for oil.
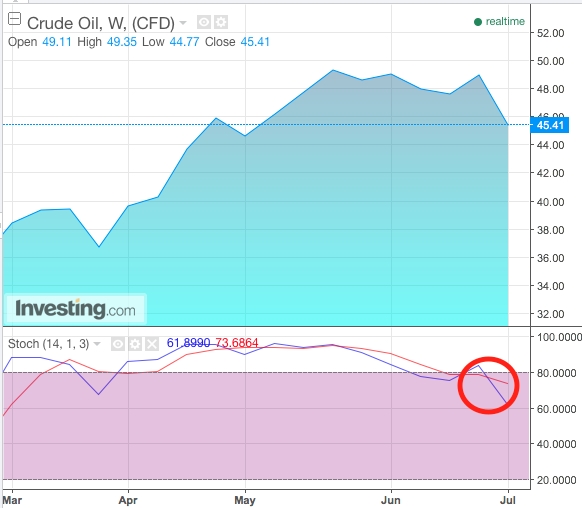
While certain technical indicators are still hinting at a downturn, the Stochastic Oscillator has already confirmed the declining trend for crude oil.
Nonetheless, it is certainly not too late to enter into short positions right now. WTI crude oil is still currently at $45.17, relatively close to its 2016 high of $51.23.
US Production Bounces Back
Over the past few weeks, the number of oil rigs back online has been soaring. After reaching a bottom of 316 rigs on May 27th, it has climbed back to 351 rigs as producers attempt to exploit the higher oil prices.
In fact, after delaying oil-drilling projects last year, large oil companies have announced big investments recently as confidence in the oil market is gradually being restored. Chevron (NYSE:CVX) proclaimed a $37 billion project and BP (LON:BP) announced an $8 billion investment over the past month.
Due to the flexibility of the labor market and lower cost of equipment (e.g. oil rigs), the US is an adaptable swing producer. Hence rising oil prices can easily attract producers back into the market in a short space of time. This increases supply and will potentially bring oil prices back down.
The EIA is forecasting that the US will produce 8.6 million barrels per day in 2016. However, a surprising increase in production from these swing producers due to the current level of oil prices may lead to more supply coming into the market, which may cause crude oil to fall well below the $46 price level forecasted by the EIA for September 2016.
As energy agencies such as the EIA are forced to lower their current bullish price targets due to higher than forecasted production, investors will inevitably have to re-adjust their perspectives towards a more bearish outlook as well, which will pressure crude oil prices downwards.
Rising demand from India and China also drove the rally in oil prices in the first half of 2016. China in particular has been engaged in ‘strategic reserve buying’, whereby in March and April, China was importing 7.7 million b/d. However, Chinese reserves are now almost full after ‘overbuying’ earlier in the year. As a result, demand growth from Asia is likely to slow in the second half, leading to greater downward pressure on oil.
Still, oil bulls argue that the US driving season, between June and September, will increase oil demand to further ease the oversupply glut. While it is true that demand will rise, the US has already produced 8.9 b/p and 8.7 b/p in April and May respectively in anticipation of the driving season. Current inventory levels are at adequate levels to satisfy the rising demand from the driving season, and there is no need to produce more oil at this point. It is therefore unlikely to provide a meaningful boost to oil prices.
The simultaneous rising US production and subdued demand growth outlook is likely to cap the oil rally. In fact, both technical and fundamental factors are indicating that crude oil will dip lower over the next few months. Traders should take advantage of the recent oil rally, as prices are currently still at attractive levels for taking short-selling positions for the medium term.


