
It has been a rough ride for those who have bought gold and silver the last few years as it heads to its biggest quarterly loss in history. We have seen the metals fall from their 2011 highs to their current lows, hit yesterday at $1,223.40 for gold and $18.36 for silver. As of yesterday, the metals have bounced off those lows with a weaker than expected GDP report.
For the reasons given below, I believe the bottom is in for gold and silver.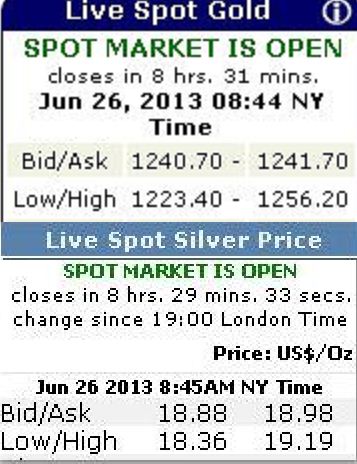
Recap of Gold and Silver Price Activity
On Feb. 14th, 2013 I wrote that I expected the Market Makers to take gold and silver below their 200 day moving averages and they did by mid-April. The price of gold and silver subsequently bounced higher and on May 17th I wrote that this might be a “Dead Cat Bounce” and the gold and silver prices would again test and break their April lows and this was confirmed just last week.
I have been very patient about writing today’s article and know there will be many who try and critique it. But I truthfully don’t believe the claims that the Fed will begin to taper as those that do think we are in an economic recovery. And those who are depicting gold and silver as an irrelevant investment can’t be seeing the same data I see. In fact, sentiment is so negative that pretty much every major investment bank
has lowered their gold price forecasts, including Goldman Sachs. You may recall Goldman Sachs was bullish on gold in 2011, raising their forecast. Just because they all agree on something, doesn’t make them right.
The economic data I wrote about on May 9th calling the stock market a bubble and recommending investors dollar cost average out of it, has been confirmed further with yesterday’s GDP expectations falling short and Tuesday’s consumer confidence, durable goods and housing data coming in at less than expected. The Dow is presently sitting at 14,760, 322 points lower than the 15,082 May 9th close. The market sometimes has a mind of its own and the Dow is presently up 122 points despite the GDP miss.
The hardest thing to do is to buy when there has been carnage in the streets. But what do Market Makers really do? They like to create carnage and invest accordingly. The name of their game is simply profit, any way they can obtain it. One can look at Apple (AAPL) 5 year charts to see how this popular stock can be moved up and down over time. 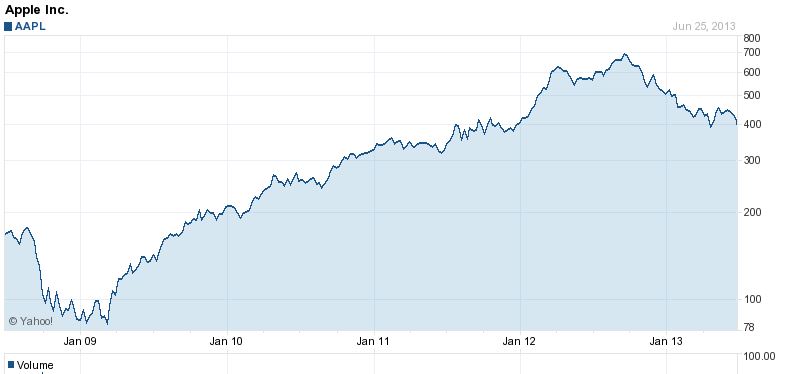
From a shorter term perspective, what has really been the difference in AAPL versus the SPDR Gold Trust ETF (GLD) and the iShares Silver Trust ETF (SLV) over the past year?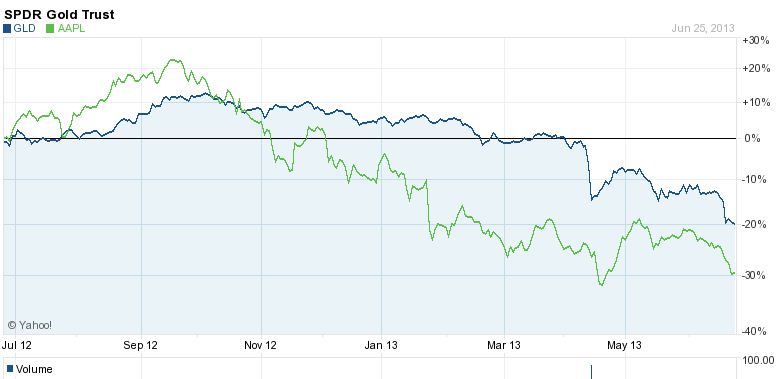
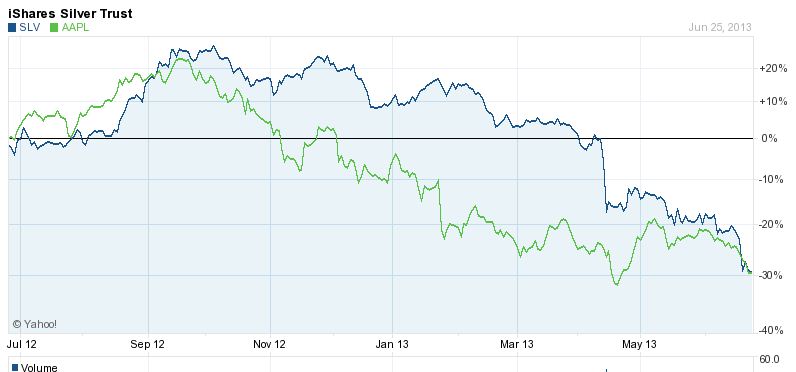
Apple’s 52 week range is 385.10 - 705.0 (45.37% decline); GLD 119.66 - 174.07 (31.25% decline); SLV 18.19 - 34.08 (46.62% decline).
What’s On the Horizon for Gold and Silver?
Below is some of the common reasoning against gold and my thoughts. Much of what I write about goes against the gold bugs typical mantra of weak dollar and inflation. I simply read the data differently than they do. Doesn’t mean they and I won’t be right in the long term, but the short term has cost many gold bugs credibility.
Strong Dollar; I have been dollar bullish since gold’s high in September of 2011. I am still dollar bullish but believe the price of gold will move higher along with the dollar. This is because the dollar simply represents a basket of other currencies, primarily the Euro/Yen/Pound, of which I am more negative on than the dollar. Perception I believe will dictate safety of the U.S. dollar, propping it up. While this typically has been negative for gold, there are many other reasons why the insurance gold provides will be a good hedge against the uncertainty with the banking systems abroad. Eventually this uncertainty will again come home to roost in the U.S.”
There Is No Inflation; I have been in the deflation camp for quite some time as the Fed continues to fight it with QE purchases that are swallowed up by the credit contraction that is still occurring from the pre-2007 excesses. When one ignores credit as part of the equation, they only see the printing of dollars and assume this will be inflationary. The result has been what Keynes describes as “pushing on a string.” The Federal Reserve can’t force businesses and consumers to spend; they can only hope they do. When they don’t spend, the Fed has to keep pumping. But there is inflation in the money supply for sure. It’s just being swallowed up by other countries that prefer to exchange their currency into dollars.
I have been approached by those living in Argentina for example, looking to buy gold in large sums by credit card since the citizens there are limited on what they can do with the funds they have at the bank. On the street, the exchange rate can be as high as 30% to exchange pesos for dollars. Argentinians remember what occurred in the 80s. I of course declined the business, but it seems that some are getting desperate there. The same could be said for those in Brazil where the real has plummeted and in India where the rupee is crashing lower of late. 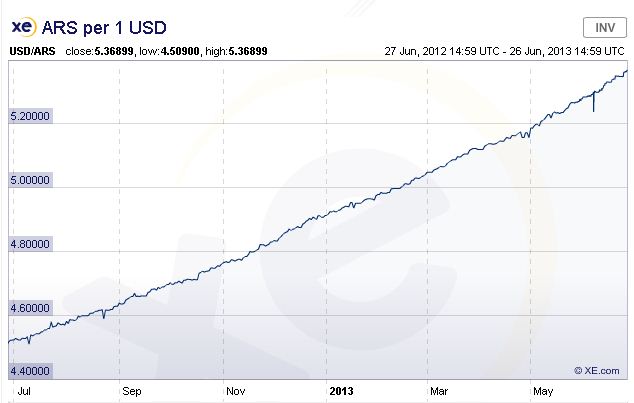
Brazilian Real vs. Dollar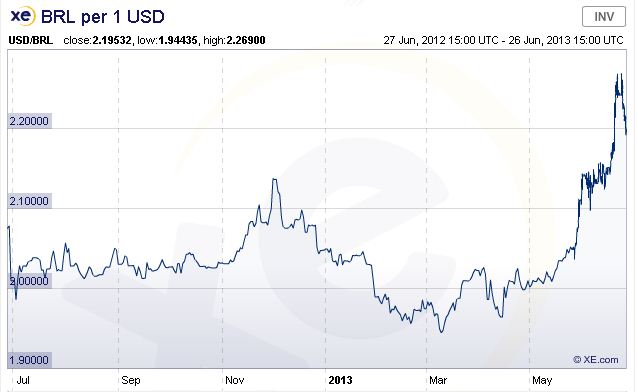
Rupee vs. Dollar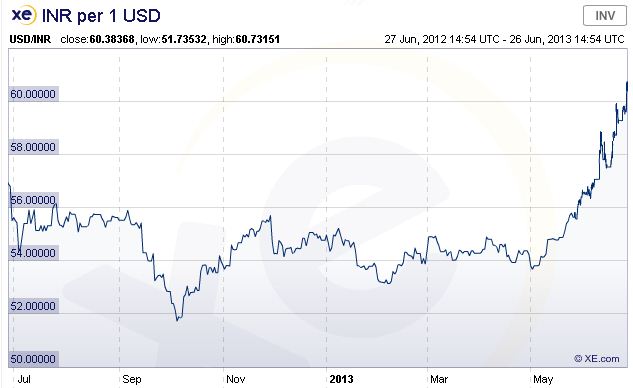
Inflation is not just a U.S. phenomenon. Those in other countries are chasing the same gold and silver with their falling currencies. Perhaps they could have planned ahead. Perhaps you should too. All currencies will be in a race to the bottom to make their products more attractive for the world to buy and increase their GDP.
The Gold Price Is Falling Despite Fed QE; Any improving economic activity is in the sectors where the Fed’s money has flowed, but the cracks are beginning to come to the surface. Higher rates are something the Fed can’t afford to occur. Don’t be fooled by any talk of a recovery. You can’t “talk” up a recovery. The data has to be there and it isn’t.
What will occur with higher interest rates? The interest on the national debt when it was $6 trillion in 2002 was 4.8% and was the same amount owed as on the almost $17 trillion debt today, about $300 billion. Higher rates mean more interest on the debt to pay. A return to the 2002 interest payment of just 4.8% means $500 billion additional interest on the debt owed, making the total owed $800 billion annually. The debt is assumed to be moving into the 20 trillion range in the next couple of years, just when interest rates will be shooting higher, unless Bernanke tries to pull more rabbits out of the hat. 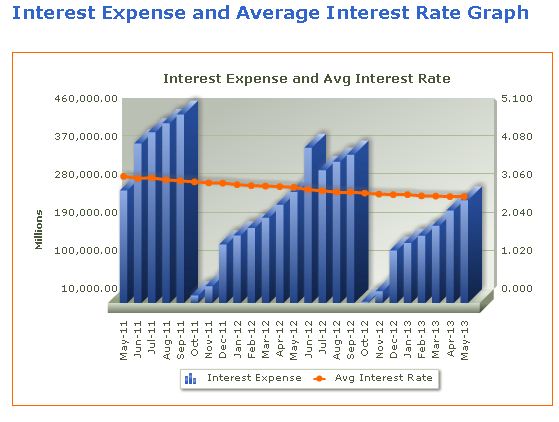
Speaking of magic, it’s all an illusion the Fed and Congress try to put upon the people. Whether it is changes to the CPI, changes to how they calculate unemployment or their latest trick, how GDP is to be calculated (past and future). To show you how absurd things are getting, I received an email from California Senator Barbara Boxer that she is introducing a bill to Congress that those in Congress would receive no pay unless they vote to raise the Debt Ceiling. Their assumption is that if Congress can keep spending money they don’t have, it will increase velocity and get the economy going again. It hasn’t so far, except in a few areas that have made a few people very wealth. Congress and the Fed didn’t see the 2007 financial crisis coming so what makes them think QE will work in stimulating the economy?
How have they done so far to the tune of trillions? When does it end? How does it end? Who will buy the Fed’s debt? The questions are aplenty.
Meanwhile, Obama is continuing Bush policies with talk of more wars (Syria and of course Iran still on the table). Obamcare is causing more layoffs and health insurance premiums to rise in some states with no caps. It’s only a guess as to how long this country can afford wars and paying for things with printed money. They have done a good job of it so far, but just a small rise in interest rates makes all the projections skewed. Banks still are not Marking to Market their assets and play a dangerous derivatives game with interest rate risk. Believe what you want from the likes of Goldman Sachs. But don’t pretend all is well in America just because the stock market has moved higher.
Gold is simply insurance against all these issues and more. Things can implode on a dime. People buy car insurance just in case someone slams into you. With the data presented above, the odds are ever increasing that you’ll need that insurance. Why not buy it cheaper?
Lastly, there have been other things working against gold. The CME has raised margin requirements by 25% on gold for the second time since April. Trading in gold futures in New York was double the average for the past 100 days and silver trading was more than triple the average, according to data compiled by Bloomberg. Is the heavy volume from the one’s lowering their price targets for precious metals? How do Market Makers make profit? Answer: Buy low.
80% Probability of Higher Prices for Gold the Next 3 Months
What gives me even more confidence that a bottom is in or close to being in, comes from the fact that 8 out of the last 10 summers, including the last 4 years straight, have been positive for gold (See Table Below). If you are conservative, this would be a safer play than silver right now, but personally I like the risk vs. reward for silver. The gold/silver ratio is almost 66 right now and I see that ratio returning to the mid 30′s range again. From gold and silver’s current prices, just to reach their 2011 highs again, it would be about a 55% return for gold but a 160% return for silver. 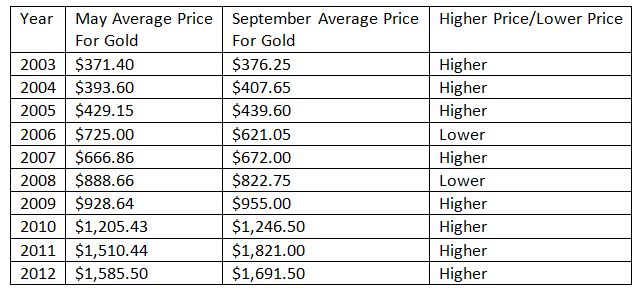
No one has a crystal ball and I certainly don’t claim to have one. I do strongly believe that the prices we see today in gold and silver will be looked back upon in the next few years as a great buying opportunity. The data I read and understand tells me the case for gold and silver is now a strong one.
I have been saying to dollar cost average into a position for a long time now. If conservative, you can still do this. I am OK with a full allocation into gold and silver at this point in time.
- English (UK)
- English (India)
- English (Canada)
- English (Australia)
- English (South Africa)
- English (Philippines)
- English (Nigeria)
- Deutsch
- Español (España)
- Español (México)
- Français
- Italiano
- Nederlands
- Português (Portugal)
- Polski
- Português (Brasil)
- Русский
- Türkçe
- العربية
- Ελληνικά
- Svenska
- Suomi
- עברית
- 日本語
- 한국어
- 简体中文
- 繁體中文
- Bahasa Indonesia
- Bahasa Melayu
- ไทย
- Tiếng Việt
- हिंदी
Is This The Bottom For Gold And Silver?
Published 06/27/2013, 12:20 AM
Updated 07/09/2023, 06:31 AM
Is This The Bottom For Gold And Silver?
Latest comments
Loading next article…
Install Our App
Risk Disclosure: Trading in financial instruments and/or cryptocurrencies involves high risks including the risk of losing some, or all, of your investment amount, and may not be suitable for all investors. Prices of cryptocurrencies are extremely volatile and may be affected by external factors such as financial, regulatory or political events. Trading on margin increases the financial risks.
Before deciding to trade in financial instrument or cryptocurrencies you should be fully informed of the risks and costs associated with trading the financial markets, carefully consider your investment objectives, level of experience, and risk appetite, and seek professional advice where needed.
Fusion Media would like to remind you that the data contained in this website is not necessarily real-time nor accurate. The data and prices on the website are not necessarily provided by any market or exchange, but may be provided by market makers, and so prices may not be accurate and may differ from the actual price at any given market, meaning prices are indicative and not appropriate for trading purposes. Fusion Media and any provider of the data contained in this website will not accept liability for any loss or damage as a result of your trading, or your reliance on the information contained within this website.
It is prohibited to use, store, reproduce, display, modify, transmit or distribute the data contained in this website without the explicit prior written permission of Fusion Media and/or the data provider. All intellectual property rights are reserved by the providers and/or the exchange providing the data contained in this website.
Fusion Media may be compensated by the advertisers that appear on the website, based on your interaction with the advertisements or advertisers.
© 2007-2024 - Fusion Media Limited. All Rights Reserved.