Forex News and Events:
The RBNZ decision to suspend the rate hikes hit the NZD complex, the kiwi has been the worst performer among its G10 peers against USD over the past 24 hours of trading. Although the accompanying statement sounded less hawkish, the NZD sell-off is likely to create dip-buying opportunities as the kiwi is still carry-interesting while the other leading central banks have no predefined schedule to start normalizing yet. In UK, the softer-than-expected retail sales data weighs on GBP, while the overall bias remains GBP-positive.
Is there any opportunity in NZD slide?
The RBNZ cut its OCR by an additional 25 basis points at July 24th meeting, with significantly less hawkish accompanying statement. The RBNZ Governor Wheeler said that the bank will suspend the rate hikes given the “unjustified and unsustainable” level of kiwi and the moderate inflation. “With the exchange rate yet to adjust to weakening commodity prices, […] there is room for significant fall” said Wheeler. A “period of assessment” is needed according to Wheeler before adjusting the interest rates back to “more neutral” levels. On trade weighted basis, the Kiwi is still at highest levels since 2008; this is more than 40% appreciation since 2009 down spike.
Data-wise, the second quarter inflation accelerated at the pace of 1.6% on yearly basis, significantly lower than 1.8% expected (vs. 1.5% last). In addition, the slowdown in house prices, the significant decline in dairy price and volumes as well as the latest deterioration in consumer and business confidence give room to Wheeler to keep the rates steady for several months ahead. We believe the status quo will remain to steady borrowing costs at least until general elections scheduled on September 20th.
The NZD/USD took a dive after Wheeler’s decision to take a breather after fourth consecutive month of rate increases. The pair sold-off to 0.8568 for the first time since June 12th, the bearish momentum reinforced as 50 and 100 dma (0.8652/0.8627 respectively) were pulled out. Despite the short-run negative bias, the oversold conditions should generate dip-buying opportunities in the NZD/USD as the Kiwi is still a good carry currency. Decent option barriers should cap the upside at 0.8600/30 area, while the critical technical support stands at the year-to-date uptrend channel bottom (currently at 0.8542).
The heavy sell-off in kiwi sent the AUD/NZD to 1.1016. Failure to break above 1.1040 (Fibo 50% on Nov’13 – Jan’14 drop) in the European opening suggest some downside correction at these levels. Resistance is seen at 1.1040/85 (Fib 50% / year-to-date uptrend top). On the NZD/JPY chart, the technicals are heavily squeezed. The 30-day lower Bollinger band (87.625) has been meaningfully breached on the downside, we expect the pair to return towards its daily Ichimoku cloud cover (87.578/87.729).
UK retail sales disappoint
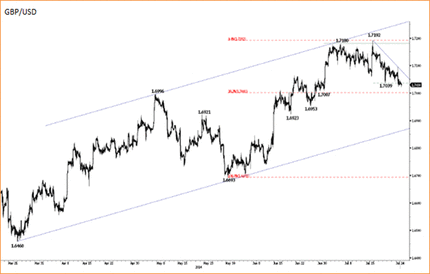
UK retail sales ex-autos unexpectedly contracted by -0.1% in month to June, pulling the retail sales growth down to 4.0% (vs. 4.7% last) on yearly basis. The retail sales including autos slowed from 3.9% to 3.6% y/y. The GBP/USD sold-off to 1.7009 as traders positioned in line with Carney’s comments on the future of BoE’s monetary policy. In his speech in Glasgow yesterday, the BoE Governor Carney highlighted the importance of data in decision to start rising the bank rates. Today’s data was clearly not supportive of BoE hawks, yet according to Confederation of British Industry, the expansion in retail sales should continue given the higher consumer spending in food and clothing.
Technically, the GBP/USD grinds steadily lower facing decent option related offers at 1.7000/25 zone for today expiry. The pair remains comfortably in its year-to-date uptrend channel (1.6888/1.7362). The next support zone is seen at 1.6923/64 (June 18th low / 50-dma).
The EUR/GBP recovered to 0.79236 post data. Trend and momentum indicators are marginally bullish after rebound from the year low of 0.78748 hit on July 23rd. Offers pre-21 dma (currently at 0.79416) should limit the rallies. More resistance is seen at June-July downtrend channel top (today at 0.79694). On the downside, decent option related offers sit at 0.78000 before the weekly closing bell.

Today's Key Issues (time in GMT):
2014-07-24T12:30:00 USD Jul 19th Initial Jobless Claims, exp 307K, last 302K2014-07-24T12:30:00 USD Jul 12th Continuing Claims, exp 2510K, last 2507K
2014-07-24T13:45:00 USD Jul P Markit US Manufacturing PMI, exp 57.5, last 57.3
2014-07-24T14:00:00 USD Jun New Home Sales, exp 475K, last 504K
2014-07-24T14:00:00 USD Jun New Home Sales MoM, exp -5.80%, last 18.60%
2014-07-24T15:00:00 USD Jul Kansas City Fed Manf. Activity, exp 6, last 6
The Risk Today:
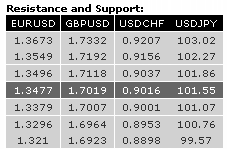
The EUR/USD has broken the key support area defined by 1.3503 (see also the long-term rising trendline from the July 2012 low) and 1.3477, confirming an underlying downtrend. Hourly resistances can be found at 1.3496 (intraday high) and 1.3513 (21/07/2014 low). In the longer term, the break of the long-term rising wedge (see also the support at 1.3673) indicates a clear deterioration of the technical structure. Downside risks are given by 1.3379 (implied by the double-top formation) and 1.3210 (second leg lower after the rebound from 1.3503 to 1.3700). A strong support stands at 1.3296 (07/11/2013 low). A resistance lies at 1.3549 (21/07/2014 high).
The GBP/USD is in a corrective phase. The hourly support at 1.7039 has been breached. Other supports can be found at 1.7007 (see also the 38.2% retracement) and 1.6953. A break of the hourly resistance at 1.7118 (18/07/2014 high) is needed to improve the short-term technical structure. Another resistance stands at 1.7192. In the longer term, the break of the major resistance at 1.7043 (05/08/2009 high) calls for further strength. Resistances can be found at 1.7332 (see the 50% retracement of the 2008 decline) and 1.7447 (11/09/2008 low). A support lies at 1.6923 (18/06/2014 low).
The USD/JPY is moving sideways within the horizontal range defined by the support at 101.07 and the resistance at 101.86. The declining channel continues to favour a bearish bias. However, monitor the hourly resistance at 101.60 (22/07/2014 high) as prices have recently exhibited a series of higher lows. A long-term bullish bias is favoured as long as the key support 99.57 (19/11/2013 low) holds. However, a break to the upside out of the current consolidation phase between 100.76 (04/02/2014 low) and 103.02 is needed to resume the underlying bullish trend. A major resistance stands at 110.66 (15/08/2008 high).
The USD/CHF has broken the resistance at 0.9013 (16/06/2014 high) and is now challenging the key resistance at 0.9037 (see also the declining channel). Initial supports can be found at 0.9016 (23/07/2014 low) and 0.9001 (intraday low). Another support lies at 0.8969 (17/07/2014 low). From a longer term perspective, the bullish breakout of the key resistance at 0.8953 (04/04/2014 high) suggests the end of the large corrective phase that started in July 2012. The long-term upside potential implied by the double-bottom formation is 0.9207. Furthermore, a break of the resistance at 0.9037 would favour a second leg higher (echoing the one started on 8 May) with an upside potential at 0.9191. A strong resistance stands at 0.9156 (21/01/2014 high).

