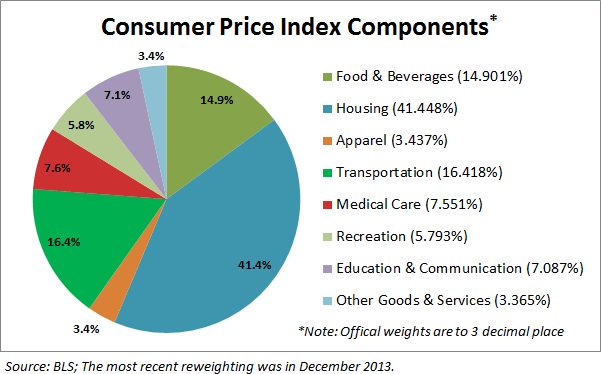
There is an obvious relationship between supply and demand. In the rental housing market, demand is eroding supply at a rapid rate according to recent data - likely due to changing demographics and preferences. The Consumer Price Index (CPI) is based 40% on housing costs - so the logical conclusion is that a rapid rise in inflation is just around the corner.
Follow up:
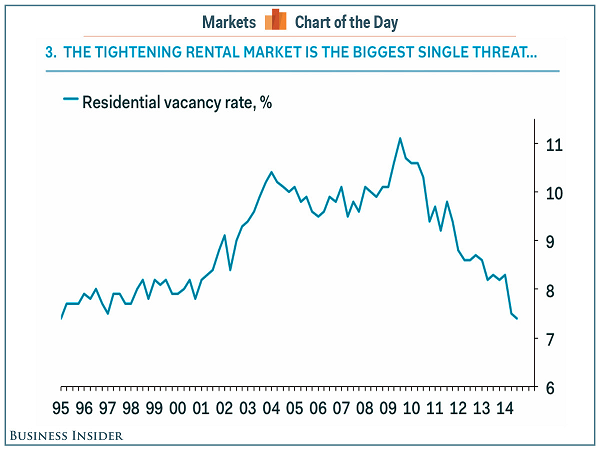
The trigger for this post was a Business Insider graphic Here's The Single Biggest Threat To Inflation which stated in part:
Renting is all the rage these days, and the tightening of the residential rental market is the biggest threat to inflation, according to Ian Shepherdson, the chief economist at Pantheon Macroeconomics. The logic is simple. When there are few places to rent, landlords will jack up prices.
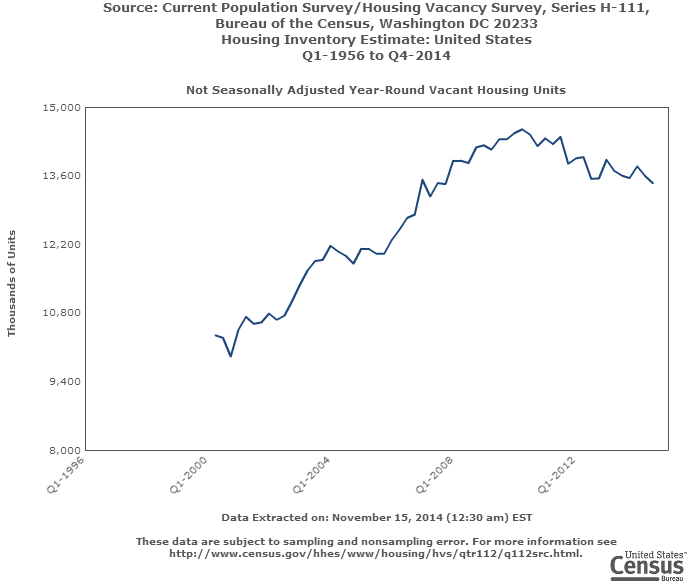
The graph below from US Census is an expanded version of the Business Insider graph but with data back to 1956.
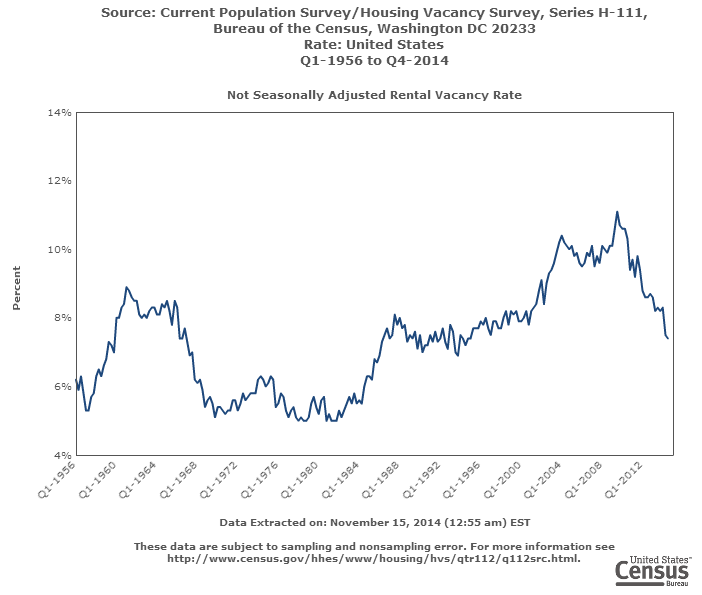
Please compare the CPI (housing portion) with the graph above. The rental housing market was tight between 1968 and 1984 - and that corresponds almost exactly with the highs in the housing portion of the CPI. Based on the current trends on the rental housing vacancy rates - it will take 2 or 4 more years to get the rental vacancy rate under 6% (where rental inflation took hold between 1968 and 1984).
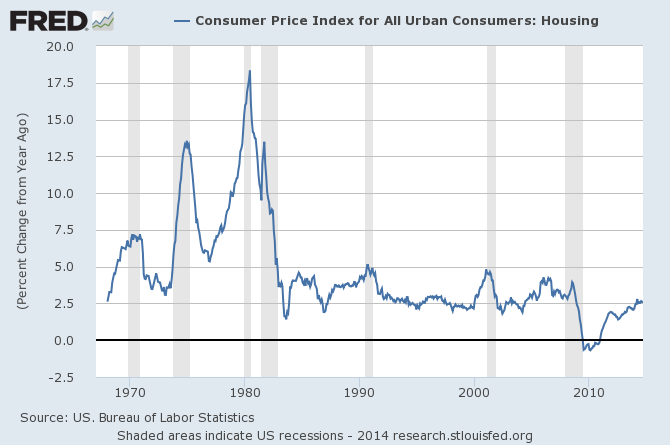
Note that the housing component of the CPI is rent of primary residence, owners' equivalent rent, fuel oil, bedroom furniture). The CPI is based on RENT and not costs for buying a home. Increases in rental prices will absolutely put upward pressure on inflation (because of the way inflation is measured). [Hat tip to Doug Short for graph below].
One fly in this argument is that in 1968 to 1984, the USA did not have 13 million VACANT residences. There is a shadow inventory of vacant potential rental units. Admittedly, many are in disrepair or in the wrong city or the wrong part of town. It is hard to believe this "shadow" potential supply of rental units will not have an affect on this timeline.
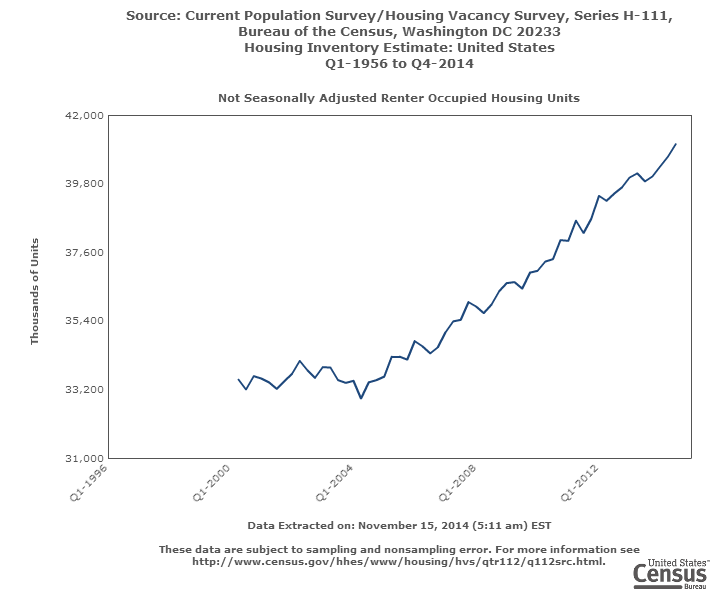
To put the situation into perspective, there are 41 million rented housing units - and the current growth rate is approximately 1 million housing units per year.
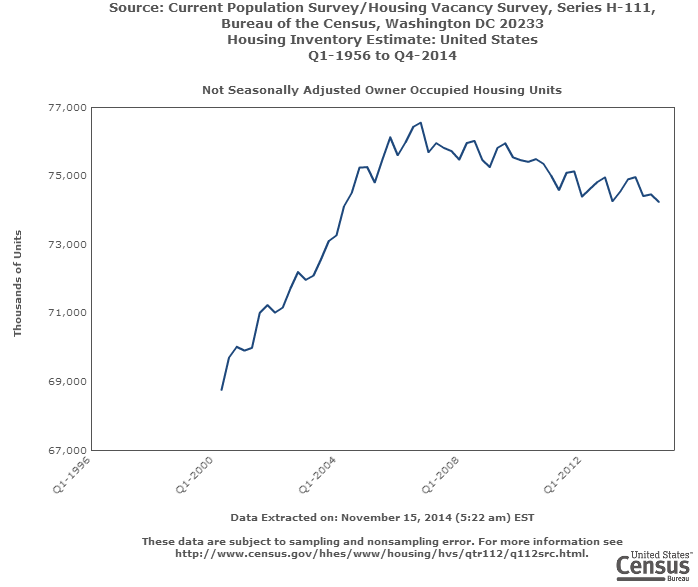
Consider that the number of owner occupied housing units is currently falling at an average rate of 1/4 million units per year.
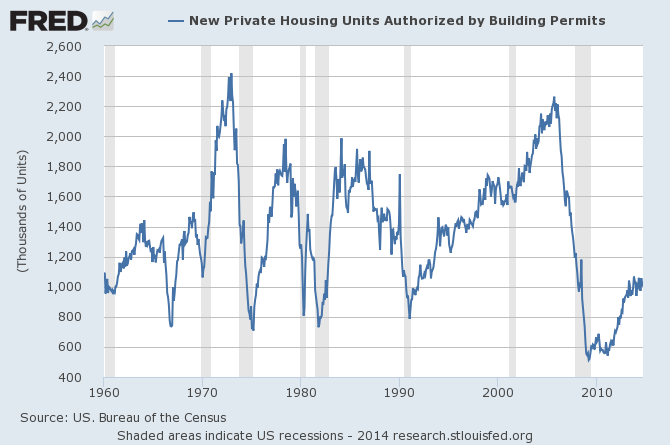
Also note that 1 million housing units are being built per year.
My bottom line is that there are enough housing units coming on the market to cover demand for housing - rental or owner occupied. I suspect the problem is one of nomenclature - a rental unit is not a rental unit until it is a rental unit.
This is not to say there may be "islands" where rental demand is below rental supply causing inflation. Further, there is some pent-up demand (kids living with parents, unrelated people living together due to financial hardship). I would never say housing inflation will not happen - but the numbers on the back of an envelope are not showing this to be an impending problem.
Other Economic News this Week:
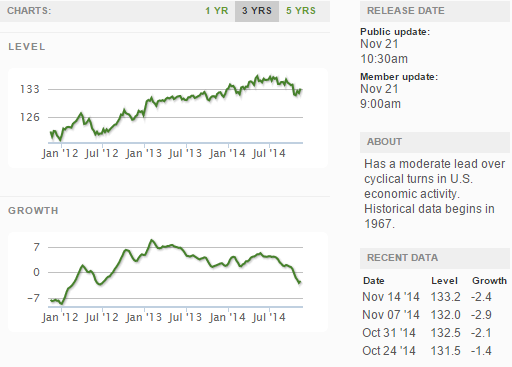
The Econintersect Economic Index for November 2014 is showing our index on the low side of a tight growth range for almost a year. Although there are no warning flags in the data which is used to compile our forecast, there also is no signs that the rate of economic growth will improve. Additionally there are no warning signs in other leading indices that the economy is stalling - EXCEPT ECRI's Weekly Leading Index at the zero growth line.
The ECRI WLI growth index value crossed slightly into negative territory which implies the economy will not have grown six months from today.
Current ECRI WLI Growth Index
The market was expecting the weekly initial unemployment claims at 265,000 to 295,000 (consensus 284,000) vs the 291,000 reported. The more important (because of the volatility in the weekly reported claims and seasonality errors in adjusting the data) 4 week moving average moved from 285,750 (reported last week as 285,000) to 287,500.
Weekly Initial Unemployment Claims - 4 Week Average - Seasonally Adjusted - 2011 (red line), 2012 (green line), 2013 (blue line), 2014 (orange line)
Bankruptcies this Week: KiOR, Dendreon, Baxano Surgical, Republic of Kazakhstan-based JSC Alliance Bank filed (Chapter 15)
Click here to view the scorecard table below with active hyperlinks
Weekly Economic Release Scorecard:
