Get 40% Off
🤯 Perficient is up a mind-blowing 53%. Our ProPicks AI saw the buying opportunity in March.Read full update

Bear Market In Progress? Watch These Levels

Published 05/26/2016, 12:19 AM
Updated 07/09/2023, 06:31 AM

The S&P 500 topped out one year ago, on May 20th, 2015 at 2134.72. One year has gone by and the SPX and has still not made a new high. It could be many years before we breach last year's high.

The SPX chart below indicates why it is not making any new highs and why a trend change is due any day, now.

From the lows of 2009, the SPX has risen in a parallel channel while never breaking/closing below it, with the exception of the beginning of this year at which time it broke down the channel and then closed below it. However, it has since recovered, as indicated in the chart below. Nevertheless, it is facing significant overhead resistance in the 2110 levels.

There is a lower high formation during all of the pullbacks, after the corrections, as can be seen in the chart below.

Whenever a long trending channel is broken, it weakens and the odds of a breakdown increase. The next move is the break of the channel which will change the uptrend into a downtrend.
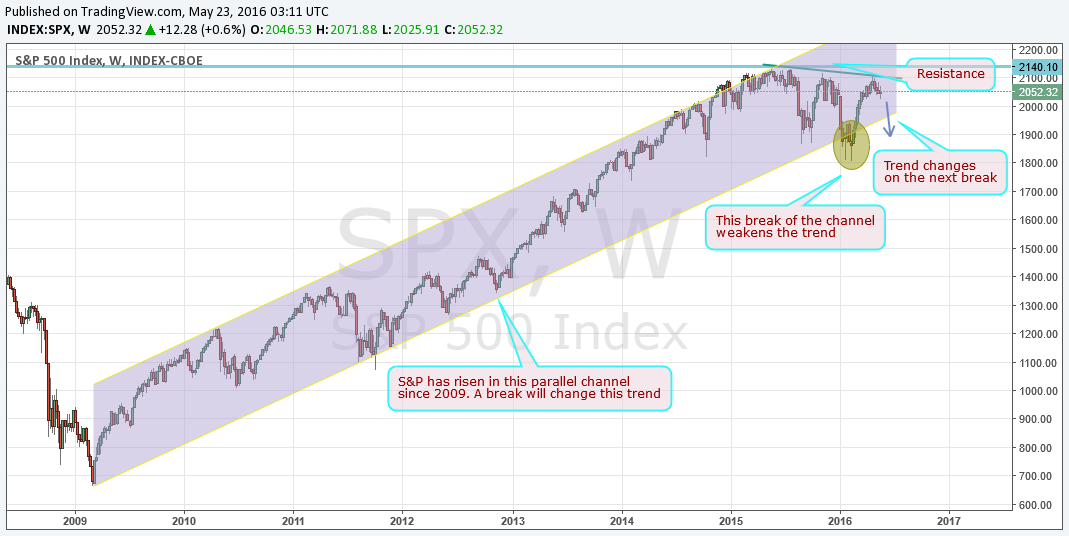
SPX Weekly 2008-2016

Allow me to analyze what the targets of the long-term break of the uptrend are.

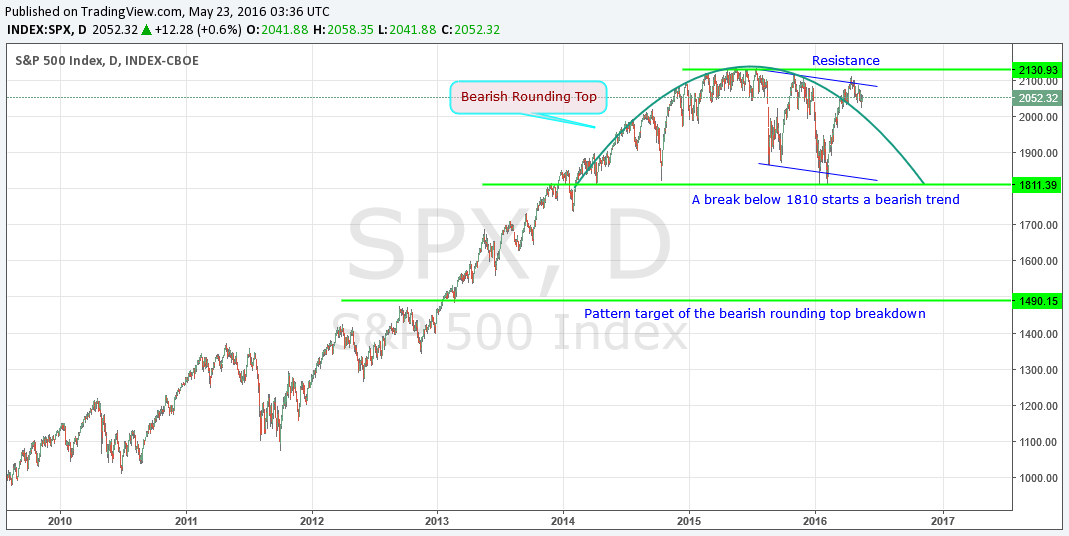
The pattern breakdown becomes confirmed below the 1810 levels. The break will form a pattern target of 1490 on the SPX. The targets usually overshoot in a bearish market, therefore,1490 is merely a ballpark figure that the markets can go much lower while falling.

Along with breakdown of the channel, the SPX is also making a long-term bearish rounding pattern, as indicated in the chart below:
3rd party Ad. Not an offer or recommendation by Investing.com. See disclosure here or remove ads .

SPX Daily 2009-2016

The long-term chart patterns are negative, however, unless the shorter time-frame also becomes negative, and a buy or a sell signal is not triggered.

Let’s see what the short-term time frame chart patterns are suggesting. The short-term pattern shows a classic ‘textbook’ example of a bearish head and shoulder pattern as depicted in the next chart, below. The pattern will be confirmed when the SPX breaks and closes below the neckline at 2040.

Below the 2040 level, the next support level comes in at the psychological 2000 level. Most traders who have been buying the dips will buy close to this level, and I expect to see a bounce. The professional traders will use any bounce off these levels to short the market, to take advantage of its long awaited downtrend.

The bearish head and shoulder pattern target on the lower end, is located at the 1970 levels. However, these targets are only rough levels for reference. The markets can easily overshoot these levels.
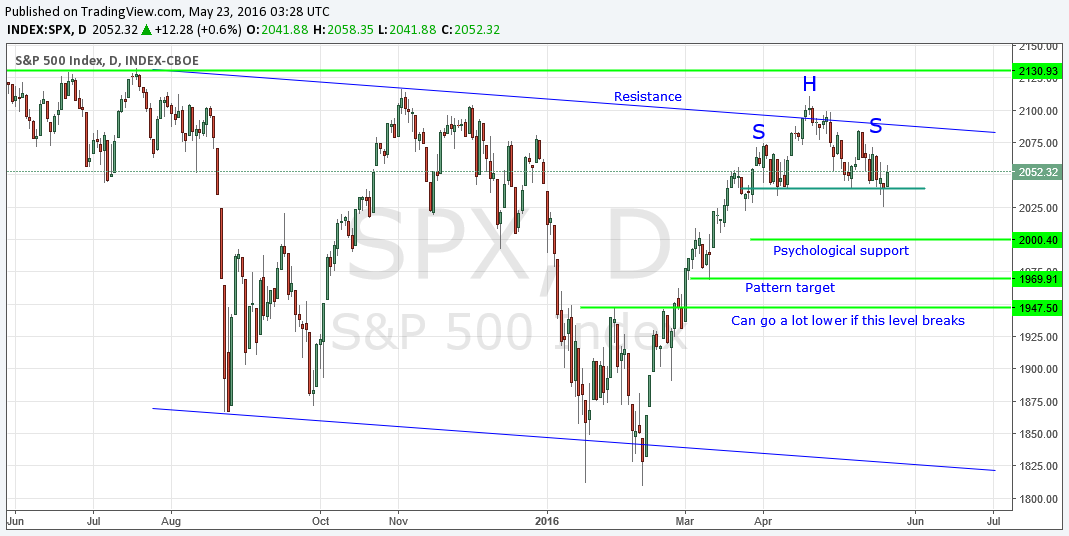
SPX Daily

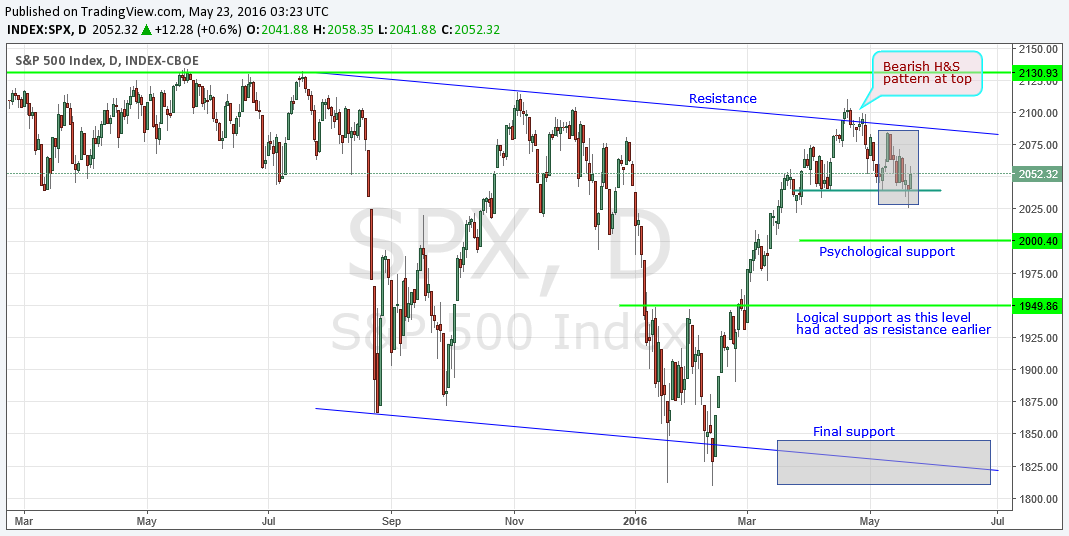
On the shorter time frame, there are various levels which can offer support during the next major decline. As explained above, the 2000 level is a ‘psychological support area’ and 1970 is the pattern target. However, upon studying the charts, I can see that 1950 levels, which had earlier acted as a resistance, will now offer support.

If the markets break below the 1950 levels, then there is no support until it drops to the lows of 1810. Once the SPX breaks below the 1810 levels, it will enter into its’ multi-year bearish trend decline. The markets do not honor any support levels once they enter a confirmed bearish trend. Hence, although 1490 is the target, markets can go much lower as long as the bearish trend continues.
3rd party Ad. Not an offer or recommendation by Investing.com. See disclosure here or remove ads .

SPX Daily with Final Support Level

I have provided all of the important levels which you should watch out for. However, no pattern plays out exactly the way we expect it should. Therefore, it is important that you keep watching and be prepared to engage in this market, at the right time.

Latest comments

this guy is a perma-bear. His chart still shows a head and shoulders that got invalidated this week. he's a good contrary indicator to go long.
Bear market? tztz, why? there is no sign at this moment. only trading range between 1800/1810 and 2100/2130... so lets look , when this points will breaks...
The fact that the regression channel resistance developing in a descending order is invalid if price breaches and sustains above 2090. Looking at the Asian markets, we see an additional room of 500 points to the upside, which could easily bring S&P towards 2100 & 2270. Below 2080, the index could edge lower towards 1977. Currently the Index is at pivot, its best easy to place an OCO order which ever executes first. Up or Down
A well thought out article....very impressed with your line of thinking ...tend to agree with it in substance..... . Just wish to add ....that the impact of the downfall will get accentuated with the approaching US elections and is likely to be greater if the Republican nominee is likely to win.
Risk Disclosure: Trading in financial instruments and/or cryptocurrencies involves high risks including the risk of losing some, or all, of your investment amount, and may not be suitable for all investors. Prices of cryptocurrencies are extremely volatile and may be affected by external factors such as financial, regulatory or political events. Trading on margin increases the financial risks.
Before deciding to trade in financial instrument or cryptocurrencies you should be fully informed of the risks and costs associated with trading the financial markets, carefully consider your investment objectives, level of experience, and risk appetite, and seek professional advice where needed.
Fusion Media would like to remind you that the data contained in this website is not necessarily real-time nor accurate. The data and prices on the website are not necessarily provided by any market or exchange, but may be provided by market makers, and so prices may not be accurate and may differ from the actual price at any given market, meaning prices are indicative and not appropriate for trading purposes. Fusion Media and any provider of the data contained in this website will not accept liability for any loss or damage as a result of your trading, or your reliance on the information contained within this website.
It is prohibited to use, store, reproduce, display, modify, transmit or distribute the data contained in this website without the explicit prior written permission of Fusion Media and/or the data provider. All intellectual property rights are reserved by the providers and/or the exchange providing the data contained in this website.
Fusion Media may be compensated by the advertisers that appear on the website, based on your interaction with the advertisements or advertisers.
© 2007-2024 - Fusion Media Limited. All Rights Reserved.