Is the Q2 Earnings Improvement Sustainable?
We are in the heart of the Q2 earnings season with a deluge of announcements this week. In total, we should see Q2 reports from close to 1000 companies, including 149 S&P 500 members.
The bulk of the reporting season will be behind us by the end of this week as we will have seen results from 378 of the S&P 500 members by then. This week’s reporting docket presents a blend of companies from different industries, ranging from ‘growthy’ momentum players like Tesla (NASDAQ:TSLA), to former stars like Whole Foods (NASDAQ:WFM), and blue-chip operators like Pfizer (NYSE:PFE) and ExxonMobil (NYSE:XOM).
We will see how the rest of this reporting season brings, but the picture emerging from what we have seen already is very encouraging - the growth rates are better, more companies are coming ahead of estimates, and there is even some modest improvement on the guidance front. Guidance still remains weak, with most companies guiding lower. But the proportion of companies guiding lower is smaller than what we have been seeing in recent quarters. And even those that don’t offer guidance have been qualitatively talking up their business outlook.
The Scorecard Thus Far (as of Friday morning, July 25th)
As of Friday, July 25th, we have seen Q2 results from 229 S&P 500 members that combined account for 58.1% of the index’s total market capitalization. Total earnings for these companies are up +9.8% from the same period last year, with a ‘beat ratio’ of 69.4% and a median surprise of +2.86%. Total revenues are up +5.4%, with a revenue ‘beat ratio’ of 63.8% and a median surprise of 0.78%.
The table below shows the summary scorecard
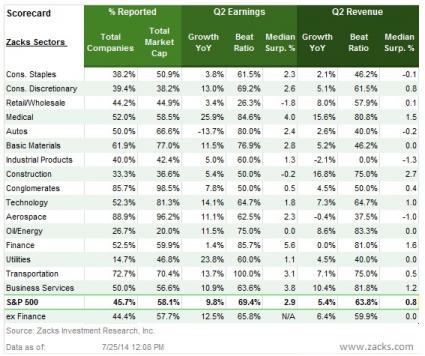
This is better performance than what we have seen from this same group of 229 companies reported in recent quarters, as the charts below shows.
The growth rate compared

The beat ratios compared
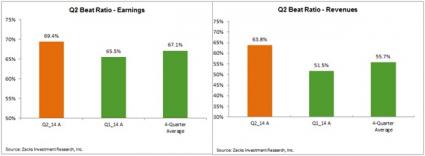
This is solid performance all around, but the top-line results are particularly notable, both in terms of growth rates as well as surprises.
The chart below compares the revenue beat ratios for the 229 S&P 500 companies in the 16 Zacks sectors at this stage with the 4-quarter average beat ratios for the same sectors (dark columns represent 2014 Q2, while the light ones represent the 4-quarter average)
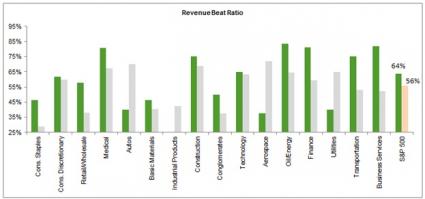
We have 6 sectors at this stage with revenue growth rates that are above the aggregate average for the S&P 500 as a whole. These are – Technology, Business Services, Transportation, Oil/Energy, Construction and Medical. But as you can see in the chart above, only three of these – Business Services, Transportation, and Oil/Energy – have surprised in a material way relative to recent history.
Technology has come out with very strong results thus far – total earnings up +14.1% on +7.3% higher revenues, but they didn’t represent as much of a surprise as from these other sectors.
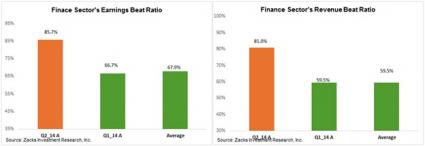
On the other hand, Finance isn’t driving growth in Q2 – total earnings up +1.4% on flat revenues, but that was better than what was expected. For the banks, there weren’t many surprises on the net interest margins, trading volumes, and mortgage business fronts – they have been weak for a while and we saw more of that in Q2 as well. What came as a pleasant surprise were signs of modest improvement in lending and investment banking. These improvements coupled with tight cost controls resulted in better than expected result for the Finance sector.
As the charts below of ‘beat ratios’ for the sector show, the 59.9% of the sector’s market capitalization that have reported Q2 results are overwhelming coming out with positive surprises.
The Composite Picture
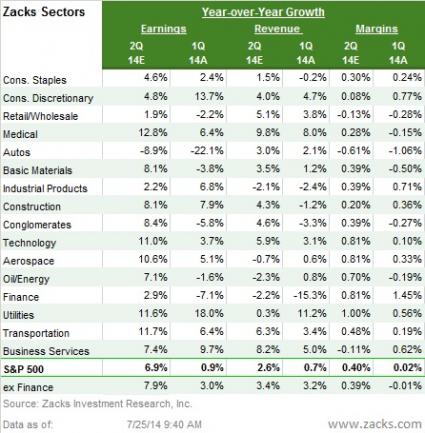
The composite (or blended) growth picture for Q2, combining the actual results for the 229 companies that have reported with estimates for the 271 still-to-come reports, shows total earnings increasing by +6.9% on +2.6% higher revenues and modestly higher net margins. This would follow earnings growth of +0.9% in Q1 on +0.7% higher revenues. The Q2 earnings growth rate has been steadily going up, as more companies report and beat estimates.
The table below compares what is expected for Q2 with what was actually achieved in Q1.
Record Earnings in Q2
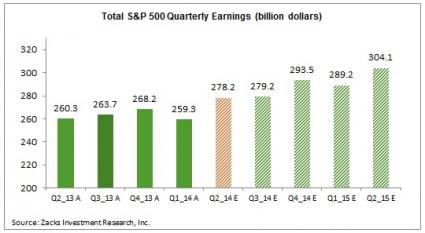
Total earnings in Q2 are on track to reach a new all-time quarterly record, surpassing the last record set in 2013 Q4. The chart below shows these quarterly earnings totals, with estimates for the coming quarters all in the record territory.
The Sustainability Question
As discussed in this report, the earnings results thus far represent a notable improvement over what we have become accustomed to seeing in recent quarters. But is it a one-off bounce from the low levels in Q1 or the start of something sustainable and enduring?
A lot will depend on how the guidance picture unfolds in the coming days. The ever so modest improvement on the guidance front at this stage, if sustained through the remainder of this earnings season, will help produce greater confidence in estimates for the current and coming quarters. Estimates for 2014 Q3 have held up very well thus far. In fact, they have moved up a tad since the current earnings season got underway. Continuation of this trend over the coming days will help answer the sustainability question.
Monday-7/28
- The June Pending Home Sales numbers will be coming out after the market opens.
- A very busy day on the earnings calendar, with 94 companies reporting Q2 results (10 S&P 500 members).
- Cummins (NYSE:CMI) and Tyson Foods (NYSE:TSN) are the notable reports in the morning, while Eastman Chemicals (NYSE:EMN) will report after the close.
Tuesday -7/29
- The two-day FOMC meeting gets underway today, while the May Case-Shiller Home Price index and the July Consumer Confidence survey results will be coming out.
- More than 230 companies will be reporting Q2 results today, including 45 S&P 500 members. Pfizer (NYSE:PFE), International Paper (NYSE:IP) and UPS (NYSE:UPS) are among a list of major companies reporting results before the markets open, while American Express (NYSE:AXP) and Panera Bread (NASDAQ:PNRA) will report after the close.
- Zacks Earnings ESP or Expected Surprise Prediction, our proprietary leading indicator of positive earnings surprises, is showing Pfizer and International Paper coming out with an earnings beat.
- Our research shows that companies with positive ESP and Zacks Rank of 1, 2 or 3 are highly likely to beat earnings estimates.
- Pfizer currently has Zacks Rank #2 (Buy) and Earnings ESP of +1.8%, while International Paper has Zacks Rank #3 (Hold) and Earnings ESP of +2.4%.
Wednesday-7/30
- A very busy day on the economic calendar, with the July ADP jobs report, the first read on Q2 GDP and the FOMC meeting announcement.
- The GDP report is expected to show bounce back in Q2, with growth of +3.2% after the -2.9% decline in Q1.
- Whole Foods (WFM), Allstate (NYSE:ALL) and Kraft (NASDAQ:KRFT) are among the major reports after the close on a day when more than 260 companies will be reporting Q2 results (36 S&P 500 members).
Thursday -7/31
- In addition to weekly Jobless Claims data, we will get the Chicago PMI data in the morning.
- We have the busiest day of the Q2 earnings season thus far, with 332 companies reporting results, including 52 S&P 500 members.
- Exxon (XOM) and ConocoPhillips (NYSE:COP) are some of the notable companies reporting in the morning, while LinkedIn (NYSE:LNKD) and Tesla Motors (TSLA) will report after the close.
- Earnings ESP is predicting positive surprises from Exxon and ConocoPhillips. Exxon has Zacks Rank #2 (Buy) and Earnings ESP of +0.5, while #2 Ranked Conoco has Earnings ESP of +1.9%.
Friday-8/1
- Jobs are the highlight on a day full of economic releases. In addition to the July non-farm payroll report, we will get the July manufacturing ISM report and the final University of Michigan Consumer Sentiment survey. The jobs report is expected to show ‘headline’ gains of 228K after June’s 288K tally.
- We have 6 S&P 500 member reporting results today, all in the morning. Chevron (NYSE:CVX) and Proctor & Gamble (PG) are some of the notable names reporting results today.
Here is a list of the 976 companies reporting this week, including 149 S&P 500 members.
| Company | Ticker | Current Qtr | Year-Ago Qtr | Last EPS Surprise % | Report Day | Time |
| CUMMINS INC | CMI | 2.39 | 2.2 | 9.58 | Monday | BTO |
| EASTMAN CHEM CO | EMN | 1.84 | 1.8 | 0.62 | Monday | AMC |
| GENL GRWTH PPTY | GGP | 0.31 | 0.27 | 3.33 | Monday | AMC |
| JACOBS ENGIN GR | JEC | 0.8 | 0.83 | -7.87 | Monday | AMC |
| MASCO | MAS | 0.28 | 0.23 | -16.67 | Monday | AMC |
| PLUM CREEK TMBR | PCL | 0.3 | 0.28 | 13.33 | Monday | AMC |
| ROPER INDS INC | ROP | 1.5 | 1.31 | 8.15 | Monday | BTO |
| RANGE RESOURCES | RRC | 0.37 | 0.3 | 5.26 | Monday | AMC |
| TYSON FOODS A | TSN | 0.83 | 0.69 | -1.64 | Monday | BTO |
| XL GROUP PLC | XL | 0.83 | 0.75 | 19.72 | Monday | AMC |
| ACCURIDE CORP | ACW | 0 | -0.11 | 50 | Monday | BTO |
| AGREE RLTY CORP | ADC | 0.55 | 0.52 | 1.89 | Monday | AMC |
| ADVENT SOFTWARE | ADVS | 0.25 | 0.05 | 0 | Monday | AMC |
| AMER FINL GROUP | AFG | 0.95 | 0.96 | 2.04 | Monday | AMC |
| ALLIANCE FIBER | AFOP | 0.32 | 0.23 | -21.21 | Monday | AMC |
| AMER CAP AGENCY | AGNC | 0.67 | 0.66 | 4.41 | Monday | AMC |
| AH BELO CORP | AHC | N/A | 0.05 | N/A | Monday | AMC |
| ALLIANCE HLDGS | AHGP | 1.05 | 1.02 | 14.14 | Monday | BTO |
| AMKOR TECH INC | AMKR | 0.14 | 0.14 | 800 | Monday | AMC |
| ALEXANDRIA REAL | ARE | 1.19 | 1.07 | 1.74 | Monday | AMC |
| ALLIANCE RES | ARLP | 0.98 | 0.98 | 26.44 | Monday | BTO |
| ARMSTRONG WORLD | AWI | 0.65 | 0.61 | -6.67 | Monday | BTO |
| BANK OF HAWAII | BOH | 0.89 | 0.85 | 1.16 | Monday | AMC |
| CAPITOL FEDL FN | CFFN | 0.14 | 0.13 | 7.69 | Monday | N/A |
| COGNEX CORP | CGNX | 0.23 | 0.19 | 10.53 | Monday | AMC |
| COMPASS MINERLS | CMP | 0.21 | 0.32 | 6.43 | Monday | BTO |
| CNO FINL GRP | CNO | 0.31 | 0.3 | 0 | Monday | AMC |
| CRANE CO | CR | 1.15 | 1.05 | 0 | Monday | AMC |
| CTS CORP | CTS | 0.22 | 0.2 | 18.75 | Monday | AMC |
| CHANGYOU.COM | CYOU | -0.19 | 1.41 | -2.78 | Monday | BTO |
| DANAOS CORP | DAC | 0.11 | 0.11 | -14.29 | Monday | AMC |
| DIANA CONTAINER | DCIX | 0 | -0.02 | 500 | Monday | BTO |
| DUCOMMUN INC DE | DCO | 0.43 | 0.51 | 35.48 | Monday | AMC |
| DIADEXUS INC | DDXS | -0.01 | -0.01 | -250 | Monday | AMC |
| DENNY'S CORP | DENN | 0.08 | 0.08 | 0 | Monday | AMC |
| DIXIE GRP INC | DXYN | -0.03 | 0.13 | -433.33 | Monday | BTO |
| EDUCATION RLTY | EDR | 0.15 | 0.13 | 6.25 | Monday | BTO |
| EXACTECH INC | EXAC | 0.3 | 0.27 | 3.45 | Monday | AMC |
| FRANKLIN ELEC | FELE | 0.61 | 0.59 | -2.78 | Monday | AMC |
| GLADSTONE INVES | GAIN | 0.18 | 0.15 | 0 | Monday | AMC |
| GREENHILL & CO | GHL | 0.31 | 0.52 | -95.83 | Monday | AMC |
| GIGOPTIX INC | GIG | -0.04 | -0.03 | 16.67 | Monday | AMC |
| GREAT SOUTH BCP | GSBC | 0.56 | 0.59 | 23.53 | Monday | AMC |
| GLOBAL SHIP LS | GSL | N/A | 0.11 | 20 | Monday | BTO |
| HERITAGE OAKS | HEOP | 0.09 | 0.09 | 83.33 | Monday | AMC |
| HERBALIFE LTD | HLF | 1.57 | 1.41 | 16.28 | Monday | AMC |
| HARMONIC INC | HLIT | -0.01 | 0.02 | 100 | Monday | AMC |
| HEALTHSOUTH CP | HLS | 0.48 | 0.51 | -2.04 | Monday | AMC |
| HOMESTREET INC | HMST | 0.58 | 0.82 | 114.29 | Monday | BTO |
| HEARTLAND FINCL | HTLF | 0.52 | 0.54 | -23.4 | Monday | AMC |
| INDEP BK MICH | IBCP | 0.18 | 0.24 | -18.75 | Monday | BTO |
| EMPRESAS ICA | ICA | 0.21 | -0.27 | -94.12 | Monday | N/A |
| INTEGR DEVICE | IDTI | 0.15 | 0.02 | 8.33 | Monday | AMC |
| INNOPHOS HLDGS | IPHS | 0.91 | 0.79 | 6.67 | Monday | AMC |
| INTEVAC INC | IVAC | -0.23 | -0.26 | 5.26 | Monday | AMC |
| J&J SNACK FOODS | JJSF | 1.2 | 1.12 | -2.7 | Monday | AMC |
| KADANT INC | KAI | 0.71 | 0.51 | 12.5 | Monday | AMC |
| KNOWLES CORP | KN | 0.17 | N/A | N/A | Monday | AMC |
| KILROY REALTY | KRC | 0.69 | 0.69 | 1.54 | Monday | AMC |
| LINCOLN ELECTRC | LECO | 0.91 | 0.91 | 1.11 | Monday | BTO |
| LUMINEX CORP | LMNX | 0.12 | 0.11 | 90.91 | Monday | AMC |
| MERCURY GENL CP | MCY | 0.67 | 0.63 | 22.22 | Monday | BTO |
| MERU NETWORKS | MERU | -0.22 | -0.13 | -18.52 | Monday | AMC |
| MONTPELIER RE | MRH | 0.98 | 0.93 | 48 | Monday | AMC |
| MIDSOUTH BANCRP | MSL | 0.33 | 0.29 | 22.22 | Monday | BTO |
| MICROSTRATEGY | MSTR | -0.16 | -0.14 | -480 | Monday | AMC |
| MAVENIR SYSTEMS | MVNR | -0.13 | N/A | 76 | Monday | AMC |
| NATL INTERST CP | NATL | 0.37 | -0.4 | 0 | Monday | AMC |
| NORWEGIAN CRUIS | NCLH | 0.57 | 0.29 | 0 | Monday | AMC |
| NISSAN ADR | NSANY | 0.44 | 0.39 | 26.09 | Monday | N/A |
| NTELOS HOLDINGS | NTLS | 0.19 | 0.3 | -80 | Monday | BTO |
| OWENS & MINOR | OMI | 0.46 | 0.46 | -4.35 | Monday | AMC |
| OLD NATL BCP | ONB | 0.24 | 0.28 | 4 | Monday | BTO |
| OPUS BANK | OPB | 0.27 | N/A | N/A | Monday | BTO |
| PDF SOLUTIONS | PDFS | 0.2 | 0.2 | 38.89 | Monday | AMC |
| PARTNERRE LTD | PRE | 2.78 | 0.9 | 40 | Monday | AMC |
| PRGX GLOBAL INC | PRGX | 0.03 | 0.06 | -200 | Monday | AMC |
| PEREGRINE SEMI | PSMI | -0.21 | -0.01 | -11.11 | Monday | AMC |
| RECKITT BENCKSR | RBGLY | N/A | N/A | N/A | Monday | N/A |
| RPM INTL INC | RPM | 0.78 | 0.72 | 33.33 | Monday | BTO |
| RYANAIR HLDGS | RYAAY | 0.68 | 0.35 | 29.63 | Monday | N/A |
| SEACOAST BKNG A | SBCF | 0.1 | 0.1 | 0 | Monday | AMC |
| SILICON MOTION | SIMO | 0.31 | 0.22 | 9.09 | Monday | AMC |
| SELECT INCOME | SIR | 0.72 | 0.77 | 4.29 | Monday | BTO |
| SOHU.COM INC | SOHU | -1.21 | 0.56 | 8.28 | Monday | BTO |
| SEASPAN CORP | SSW | 0.23 | 0.18 | 123.81 | Monday | AMC |
| STERLING BANCP | STL | 0.18 | 0.15 | -5.88 | Monday | AMC |
| TENNECO INC | TEN | 1.24 | 1.1 | 5.81 | Monday | BTO |
| TGC INDUSTRIES | TGE | 0 | -0.18 | 31.25 | Monday | BTO |
| TILE SHOP HLDGS | TTS | 0.11 | 0.13 | -25 | Monday | AMC |
| MONOTYPE IMAGNG | TYPE | 0.23 | 0.22 | 0 | Monday | BTO |
| CONTROLADORA VL | VLRS | -0.04 | 0 | 25 | Monday | BTO |
| VIRTUS INVESTMT | VRTS | 2.49 | 1.91 | -0.43 | Monday | AMC |
| BERKLEY (WR) CP | WRB | 0.78 | 0.65 | 28.21 | Monday | AMC |
| AETNA INC-NEW | AET | 1.61 | 1.52 | 26.92 | Tuesday | BTO |
| AFLAC INC | AFL | 1.59 | 1.62 | 6.29 | Tuesday | AMC |
| AFFIL MANAGERS | AMG | 2.59 | 2.18 | 4.64 | Tuesday | BTO |
| AMGEN INC | AMGN | 1.99 | 1.88 | 2.76 | Tuesday | AMC |
| AMERIPRISE FINL | AMP | 1.99 | 1.69 | 9.09 | Tuesday | AMC |
| ANADARKO PETROL | APC | 1.33 | 1.05 | 5.88 | Tuesday | AMC |
| AMER EXPRESS CO | AXP | 1.38 | 1.27 | 2.31 | Tuesday | AMC |
| BOSTON PPTYS | BXP | 1.33 | 1.29 | -2.44 | Tuesday | AMC |
| CBRE GROUP INC | CBG | 0.35 | 0.31 | 47.06 | Tuesday | AMC |
| CH ROBINSON WWD | CHRW | 0.77 | 0.7 | 1.61 | Tuesday | AMC |
| CINCINNATI FINL | CINF | 0.45 | 0.61 | -14.55 | Tuesday | AMC |
| CONSOL ENERGY | CNX | 0.25 | -0.03 | 165 | Tuesday | BTO |
| ECOLAB INC | ECL | 1.02 | 0.86 | 0 | Tuesday | BTO |
| EQUITY RESIDENT | EQR | 0.77 | 0.71 | 0 | Tuesday | AMC |
| EXPRESS SCRIPTS | ESRX | 1.22 | 1.11 | -1.98 | Tuesday | AMC |
| EATON CORP PLC | ETN | 1.11 | 1.09 | 1 | Tuesday | BTO |
| ENTERGY CORP | ETR | 1.14 | 1.01 | 8.53 | Tuesday | BTO |
| EDWARDS LIFESCI | EW | 0.77 | 0.82 | 11.76 | Tuesday | AMC |
| FIDELITY NAT IN | FIS | 0.63 | 0.71 | 21.43 | Tuesday | BTO |
| FISERV INC | FISV | 0.81 | 0.75 | 10.81 | Tuesday | AMC |
| AGL RESOURCES | GAS | 0.41 | 0.41 | -25.95 | Tuesday | AMC |
| CORNING INC | GLW | 0.37 | 0.32 | 3.33 | Tuesday | BTO |
| GENWORTH FINL | GNW | 0.35 | 0.27 | 8.33 | Tuesday | AMC |
| HARRIS CORP | HRS | 1.27 | 1.41 | 6.72 | Tuesday | BTO |
| INTL PAPER | IP | 0.82 | 0.52 | 7.02 | Tuesday | BTO |
| ILL TOOL WORKS | ITW | 1.2 | 1.08 | 3.06 | Tuesday | BTO |
| KIMCO REALTY CO | KIM | 0.34 | 0.35 | 0 | Tuesday | AMC |
| MARRIOTT INTL-A | MAR | 0.67 | 0.57 | 7.84 | Tuesday | AMC |
| MCGRAW HILL FIN | MHFI | 0.97 | 0.92 | 2.3 | Tuesday | BTO |
| MARTIN MRT-MATL | MLM | 1.23 | 0.88 | -12.9 | Tuesday | BTO |
| MARSH &MCLENNAN | MMC | 0.75 | 0.7 | 0 | Tuesday | BTO |
| MERCK & CO INC | MRK | 0.82 | 0.84 | 11.39 | Tuesday | BTO |
| NEXTERA ENERGY | NEE | 1.46 | 1.46 | 15.6 | Tuesday | BTO |
| NEWMONT MINING | NEM | 0.2 | -0.1 | 22.22 | Tuesday | AMC |
| NEWFIELD EXPL | NFX | 0.5 | 0.37 | 10 | Tuesday | AMC |
| NIELSEN NV | NLSN | 0.57 | 0.46 | 7.89 | Tuesday | BTO |
| NATL OILWELL VR | NOV | 1.45 | 1.33 | 0.72 | Tuesday | BTO |
| OWENS-ILLINOIS | OI | 0.82 | 0.81 | 3.33 | Tuesday | AMC |
| PACCAR INC | PCAR | 0.89 | 0.82 | 2.67 | Tuesday | BTO |
| PFIZER INC | PFE | 0.56 | 0.56 | 3.64 | Tuesday | BTO |
| REYNOLDS AMER | RAI | 0.87 | 0.84 | -2.7 | Tuesday | BTO |
| UTD PARCEL SRVC | UPS | 1.24 | 1.13 | -10.09 | Tuesday | BTO |
| VERTEX PHARM | VRTX | -0.74 | -0.22 | -21.43 | Tuesday | AMC |
| WASTE MGMT-NEW | WM | 0.59 | 0.54 | 8.89 | Tuesday | BTO |
| XYLEM INC | XYL | 0.44 | 0.36 | 6.25 | Tuesday | BTO |
| AMER ASSETS TR | AAT | 0.38 | 0.37 | 0 | Tuesday | AMC |
| ACADIA HEALTHCR | ACHC | 0.31 | 0.26 | 0 | Tuesday | AMC |
| ARCH COAL INC | ACI | -0.48 | -0.29 | -42.86 | Tuesday | BTO |
| ACCESS MIDSTRM | ACMP | 0.27 | 0.18 | -51.61 | Tuesday | AMC |
| ACTIVE POWER | ACPW | -0.12 | 0.02 | -58.33 | Tuesday | BTO |
| ASSOC ESTATES | AEC | 0.32 | 0.31 | -6.25 | Tuesday | AMC |
| AEGION CORP | AEGN | 0.35 | 0.34 | 30 | Tuesday | AMC |
| AEGERION PHARMA | AEGR | -0.42 | -0.66 | -54.29 | Tuesday | AMC |
| AGCO CORP | AGCO | 1.68 | 2.15 | 30.38 | Tuesday | BTO |
| AIXTRON AG-ADR | AIXG | -0.1 | -0.16 | -50 | Tuesday | BTO |
| GALLAGHER ARTHU | AJG | 0.72 | 0.73 | 52 | Tuesday | AMC |
| ACADIA RLTY TR | AKR | 0.34 | 0.31 | 0 | Tuesday | AMC |
| AK STEEL HLDG | AKS | -0.04 | -0.15 | 6.98 | Tuesday | BTO |
| ALLY FINANCIAL | ALLY | 0.32 | N/A | N/A | Tuesday | BTO |
| APPLD MICRO CIR | AMCC | -0.04 | -0.04 | 57.14 | Tuesday | AMC |
| AMREIT INC | AMRE | 0.24 | 0.25 | 4.55 | Tuesday | AMC |
| AMERIGAS PARTNR | APU | -0.39 | -0.43 | -21.92 | Tuesday | AMC |
| AMER REALTY CAP | ARCP | 0.22 | 0.17 | -10.34 | Tuesday | BTO |
| APOLLO COMMERCL | ARI | 0.35 | 0.3 | -5.26 | Tuesday | AMC |
| ARROW ELECTRONI | ARW | 1.42 | 1.12 | 0.83 | Tuesday | BTO |
| ARDMORE SHIPPIN | ASC | -0.03 | -0.04 | 0 | Tuesday | BTO |
| ATLANTIC TELE-N | ATNI | 0.44 | 0.56 | 2.08 | Tuesday | AMC |
| AUDIOCODES LTD | AUDC | 0.04 | 0.02 | -66.67 | Tuesday | BTO |
| AVX CORP | AVX | 0.17 | 0.16 | 53.33 | Tuesday | BTO |
| ANIXTER INTL | AXE | 1.63 | 1.39 | 2.86 | Tuesday | BTO |
| AXIS CAP HLDGS | AXS | 1.22 | 0.43 | -8.4 | Tuesday | AMC |
| BLACK BOX CORP | BBOX | 0.43 | 0.54 | 6.67 | Tuesday | AMC |
| BARRETT BUS SVS | BBSI | 0.93 | 0.8 | -2.04 | Tuesday | N/A |
| BIG 5 SPORTING | BGFV | 0.17 | 0.28 | 11.11 | Tuesday | AMC |
| BALLARD PWR SYS | BLDP | -0.03 | -0.05 | 25 | Tuesday | AMC |
| DYNAMIC MATLS | BOOM | 0.2 | 0.25 | 50 | Tuesday | AMC |
| BP PLC | BP | 1.2 | 0.86 | -5.45 | Tuesday | BTO |
| BUFFALO WLD WNG | BWLD | 1.19 | 0.88 | 10.37 | Tuesday | AMC |
| BLACKSTONE MRTG | BXMT | 0.4 | 0.22 | -19.05 | Tuesday | AMC |
| CALIX INC | CALX | -0.05 | -0.01 | 35.29 | Tuesday | AMC |
| CAMTEK LIMITED | CAMT | 0.03 | 0.03 | N/A | Tuesday | BTO |
| CAI INTL INC | CAP | 0.7 | 0.75 | -4.55 | Tuesday | AMC |
| CARBONITE INC | CARB | -0.09 | -0.06 | 66.67 | Tuesday | BTO |
| CASTLE (AM) &CO | CAS | -0.4 | 0.02 | -272.22 | Tuesday | BTO |
| CBL&ASSOC PPTYS | CBL | 0.54 | 0.55 | 0 | Tuesday | AMC |
| CIBER INC | CBR | 0.06 | 0.04 | 0 | Tuesday | BTO |
| CBIZ INC | CBZ | 0.14 | 0.22 | 10.26 | Tuesday | BTO |
| CORP EXEC BRD | CEB | 0.64 | 0.67 | -20.34 | Tuesday | AMC |
| CEMPRA INC | CEMP | -0.55 | -0.16 | -6.25 | Tuesday | AMC |
| CHEMTURA CORP | CHMT | 0.37 | 0.4 | -37.5 | Tuesday | AMC |
| CLOUD PEAK EGY | CLD | 0.01 | -0.02 | -450 | Tuesday | AMC |
| CALAMOS ASSET-A | CLMS | 0.13 | 0.22 | 66.67 | Tuesday | AMC |
| COMMUNITYONE BC | COB | 0.11 | -0.15 | N/A | Tuesday | BTO |
| CAPELLA EDUCATN | CPLA | 0.84 | 0.83 | -4.11 | Tuesday | BTO |
| COMPUWARE CORP | CPWR | 0.03 | 0.07 | 0 | Tuesday | AMC |
| CRAY INC | CRAY | -0.38 | -0.22 | -12.77 | Tuesday | AMC |
| CARPENTER TECH | CRS | 0.77 | 0.77 | 1.79 | Tuesday | BTO |
| CASTLIGHT HLTH | CSLT | -0.25 | N/A | -157.14 | Tuesday | AMC |
| COVANCE INC | CVD | 0.93 | 0.78 | 0 | Tuesday | AMC |
| COMMVAULT SYSTM | CVLT | 0.2 | 0.2 |
