
The dollar traded mixed against the other G10 currencies during the European morning. It was higher against The SEK, AUD, NZD and GBP, while it depreciated against the JPY, NOK and CHF. It remained near its opening levels vs EUR and CAD.
The SEK was today’s main loser, as Sweden’s CPI for January fell -0.2% yoy, missing estimates of +0.1% yoy and driving the country into deflationary conditions. If the index remains below zero in February, this would signal officially that the country is facing deflation. SEK collapsed at the release, driving the USD/SEK 525 pips higher.
The AUD was the second loser in line. The AUD/USD fell after hitting the 38.2% retracement of the 22nd Oct.- 24th Jan. decline. Further depreciation in the near future, and a clear close below the 0.8905 barrier may confirm my view that the recent advance was just an upward retracement of the prevailing longer term downtrend.
The UK CPI unexpectedly slowed to +1.9% yoy in January, below the Bank of England’s 2% target for the first time since November 2009. The GBP/USD fell only 25 pips at the release, perhaps because the market already knows that the Bank will maintain rates at low levels, thus the +1.9% inflation rate does not necessarily imply that it will keep rate low for longer than it would have otherwise.
The German ZEW survey for February was also out. The current situation index rose to 50.0, beating estimates of 44.0, while the expectations index fell to 55.7, below expectations of 61.5. EUR/USD declined only 15 pips on the expectations release, to trade near its opening levels.
The GBP/AUD seems to be trading within a bullish flag formation. A clear violation of the flag’s upper boundary, followed by a break of the resistance at 1.8607 (R1), may confirm the pattern and open the way for the 161.8% Fibonacci extension level of the rally preceded the formation at 1.8900. The RSI violated its blue resistance line, while the MACD, already above its trigger line, is ready to obtain a positive sign and signal bullish momentum. On the 4-hour chart, a possible double bottom has been completed on the 13th of February, increasing the probabilities for further advance.
Support: 1.8415 (S1), 1.8270 (S2), 1.8130 (S3)
Resistance: 1.8607 (R1), 1.8685 (R2), 1.8790 (R3)
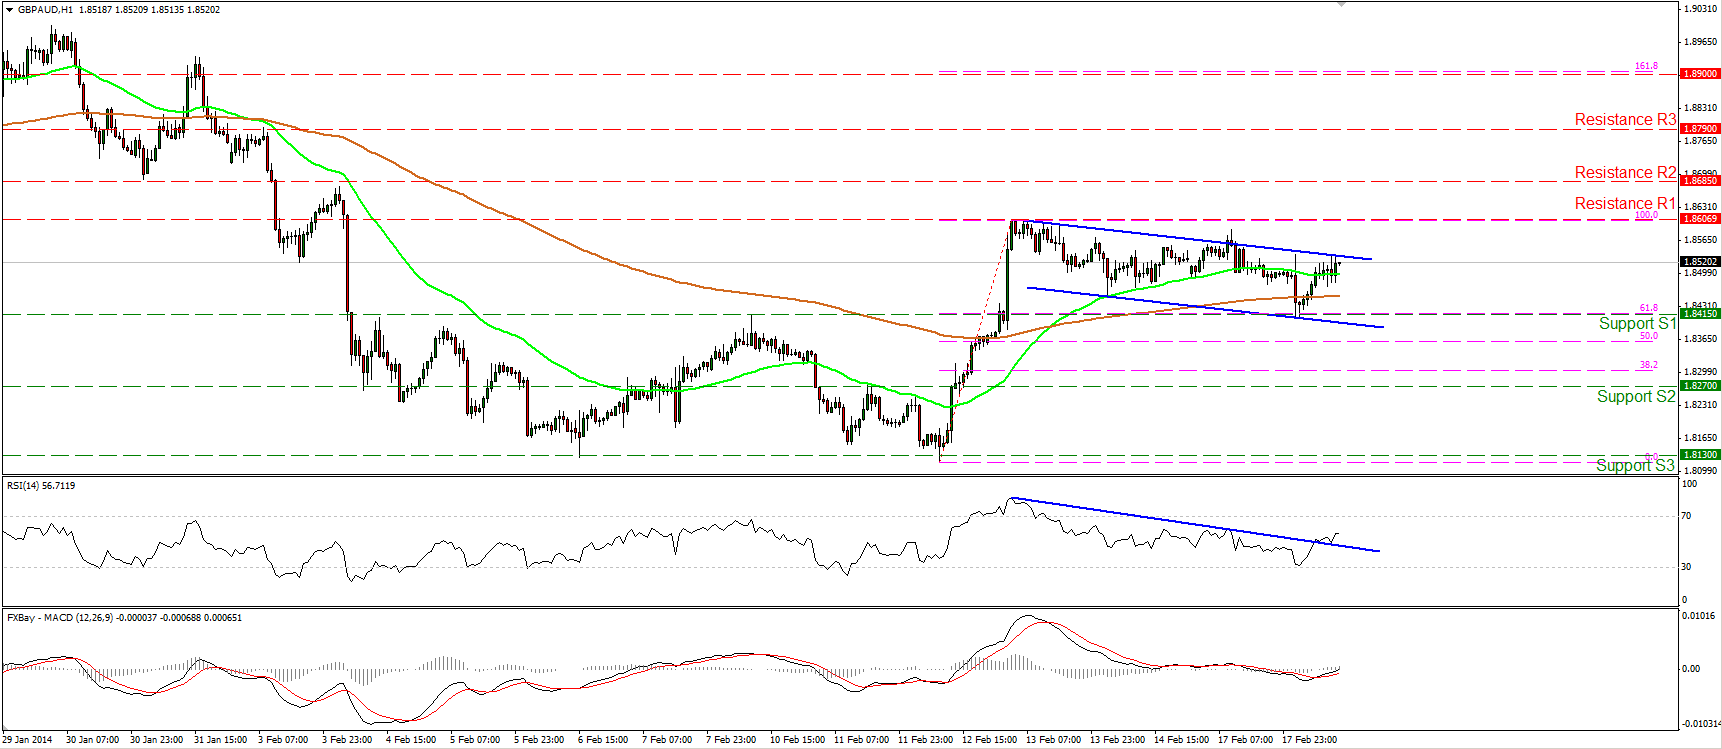 GBP/AUD Hour Chart" title="GBP/AUD Hour Chart" width="474" height="242">