An extended stint in oversold territory has many traders questioning just when the bearish Aussie dollar will correct itself. However, oversold stochastics may be masking the underlying weakness which is set to continue driving the pair lower. Additionally, as the market prices in the likelihood of a US rate hike, the AUD might move to test—or even break—the January low.
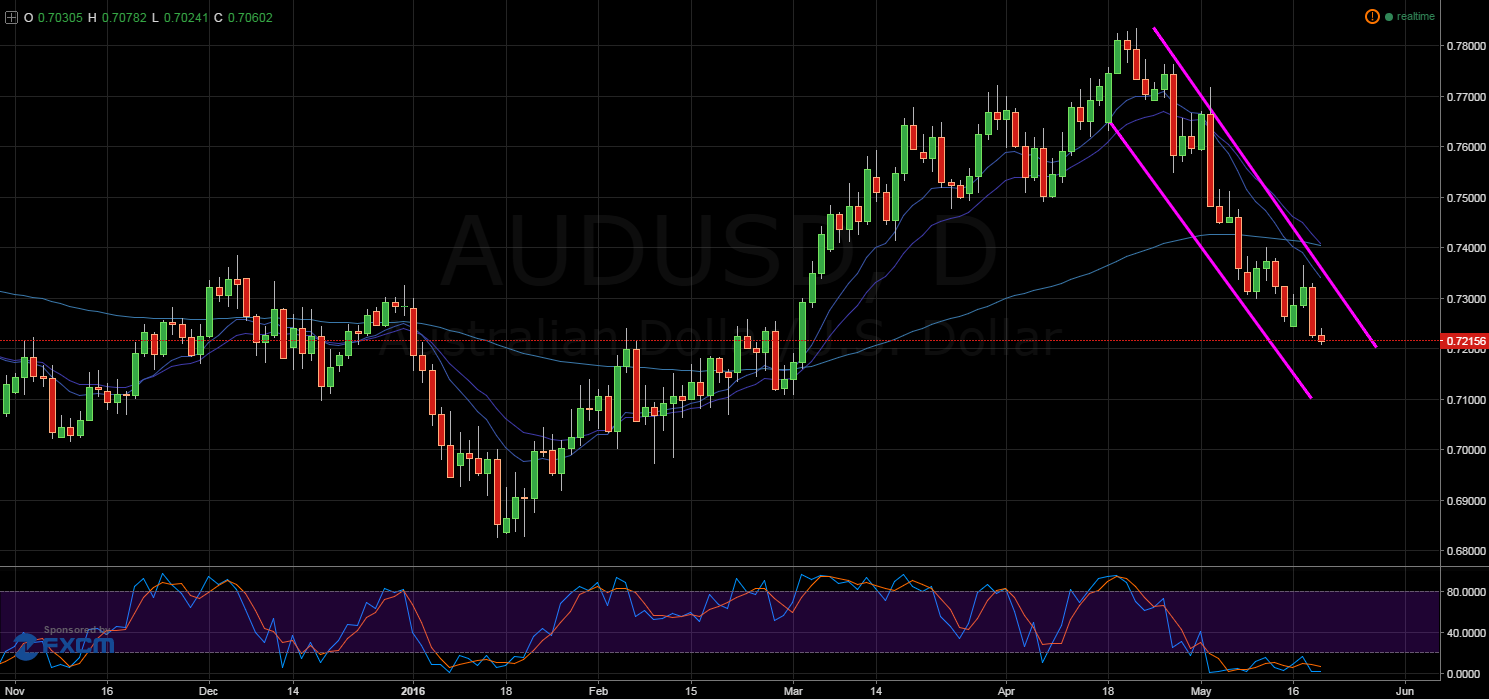
Firstly, a quick look at the daily chart shows that the Aussie dollar has been tumbling for a decent period of time. Whilst the pair is now moving in line with commodity prices, the extended duration of the AUD’s oversold status brings into question just when the pair might correct itself. However, it could be the case that the stochastic oscillator is actually obscuring the underlying weakness of the Aussie dollar.

As shown on the daily chart, the pair is clearly in a bearish channel and stochastics are signalling that the AUD should find support relatively soon. However, whilst it could enter a ranging phase in the short term, the pair could also see itself taking another slip. In fact, this has been the case twice already as the Aussie dollar has taken two significant dips whilst being heavily oversold.

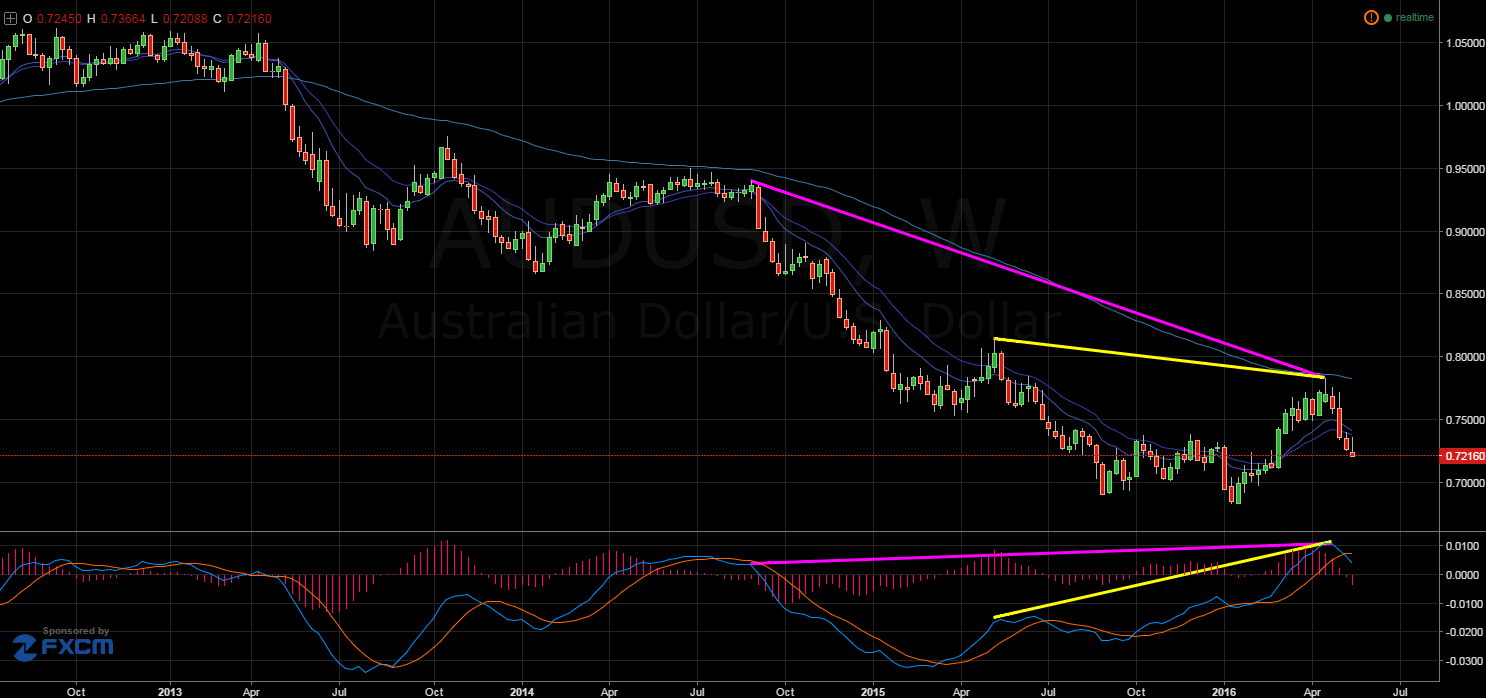
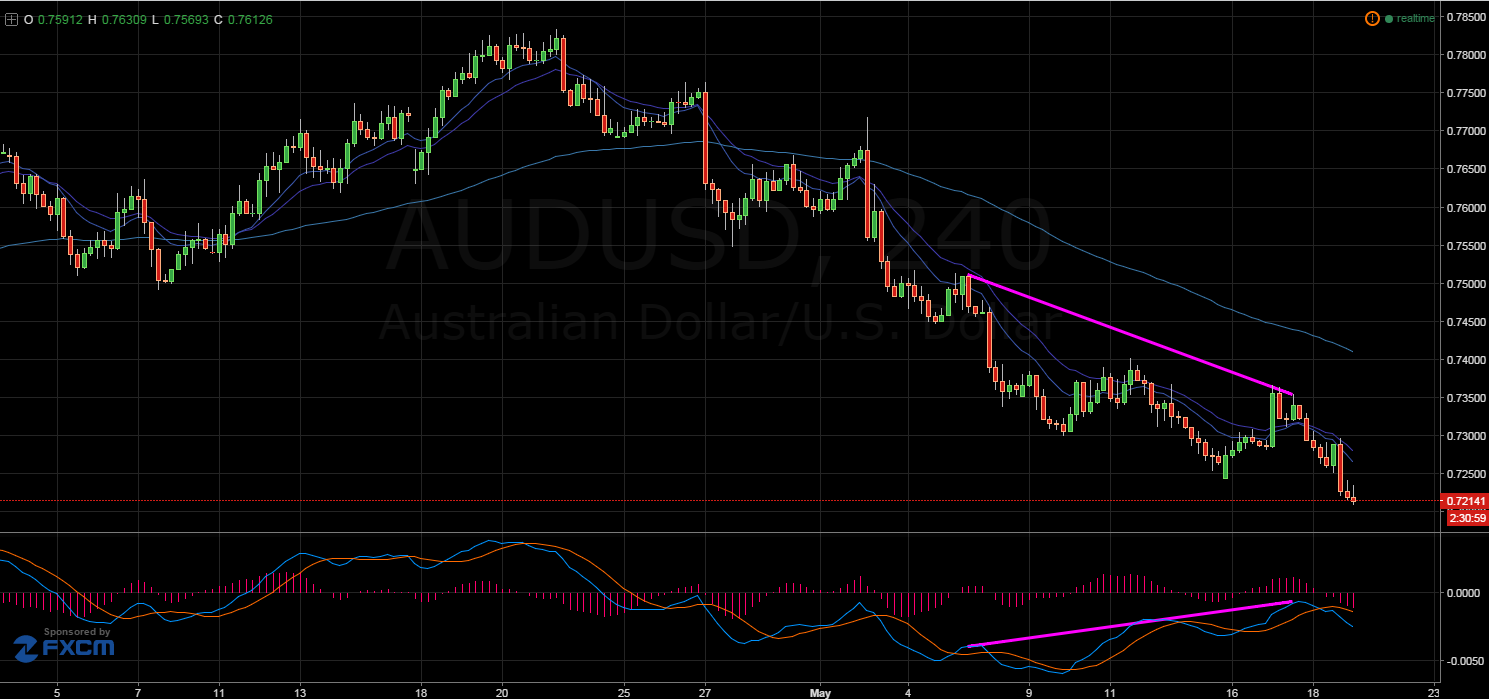
Moreover, looking at the pair from a longer term perspective demonstrates that the AUD should continue to decline in the future. Specifically, on the weekly chart, a relatively strong hidden divergence has occurred which could indicate that this downtrend is continuing. Likewise, a divergence on the H4 chart is signalling that a continuation pattern may have already begun. What’s more, on both the weekly and H4 charts, a crossover has occurred on the MACD oscillator which is yet another strong bearish indicator.

In addition to MACD divergences and crossovers, it is unlikely that the AUD will be able to recover strongly before trending down as a result of the 100 day and 100 week EMA’s. Firstly, the 100 day EMA is about to fully crossover with the not only the 12 day but also the 20 day EMA. Of course, this crossover is a good signal that a more long-term downtrend is taking hold of the Aussie dollar. In addition, the 100 week EMA is acting as dynamic resistance which severely limits the upside potential of the pair.
Ultimately, a weaker AUD is not overly surprising given the general collapse of commodity prices. As a result of this, the recent bullishness of the Aussie has been met with some raised eyebrows. Most notably, the RBA has continually questioned the pair’s strength in the low commodity price environment. Only recently the Reserve Bank chose to cut rates in order to force a change in momentum that jawboning alone couldn’t quite achieve.
As a result, the market finally seems to have taken the hint and the weakness of the currency is coming to light. Therefore, the real question may now not be when will the AUD recover in the short term, but how low will it tumble in the long run.
