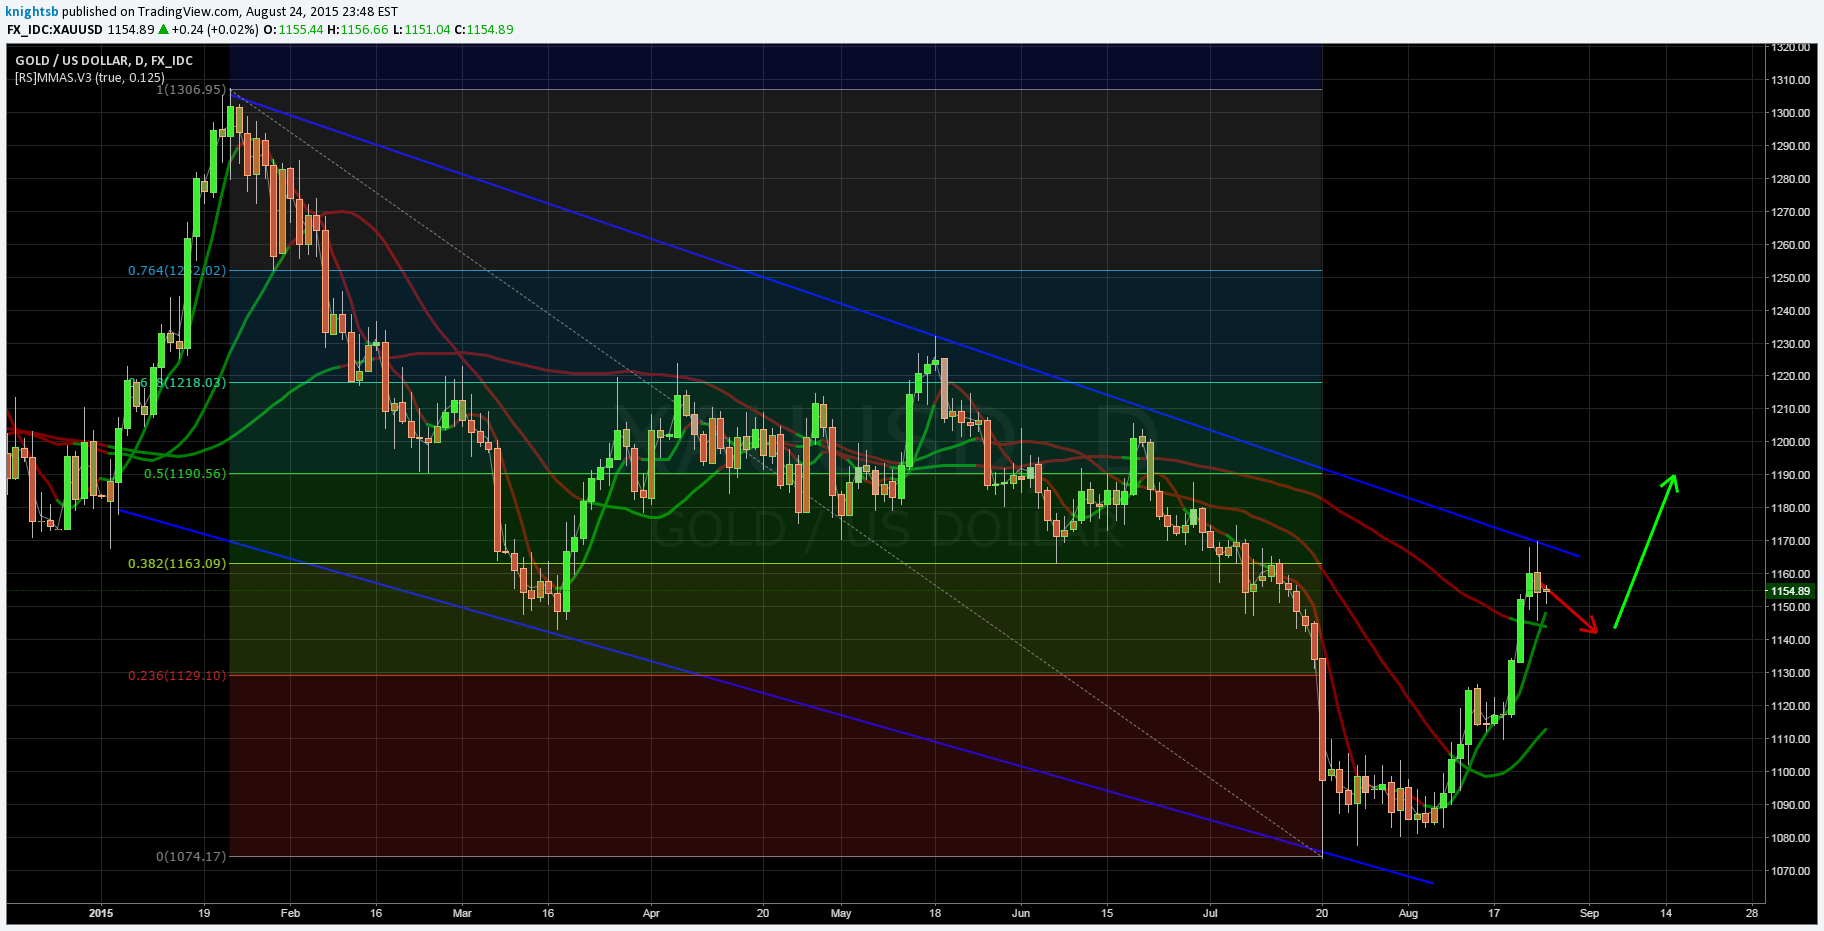
As the turmoil from the equity market decline spreads around the globe, Gold looks like it might be finally ready to challenge the long term bearish trend line.
The precious metal has steadily fallen since January on the belief that the U.S. economy was doing better and the Fed was close to raising rates (Protip: They’re not!). Subsequently, Gold prices have steadily declined from the January high of $1307.32 until resting well below the $1100 handle.
That was until approximately two weeks ago when something inexplicable occurred…traders woke up to the fact they had been fooled. Instead of a rampant U.S. economy with strong price inflation, we ended up with a declining commodity market and indications from the Fed showing that inflation may not reach the 2% target until 2020 at the earliest. That’s the point when the cracks appeared in the short sentiment.
After the internal U.S. Federal Reserve modelling was leaked, the yellow metal managed to consolidate sideways as the spectre of a September rate rise slipped away. Gold then managed to slowly climb as the air evaporated out of the case for a rate rise as traders truly found that the empress had no clothes (That’s a scary image considering the average age of an FOMC member).
As Gold started to form a bullish leg, from the bottom of the bearish channel, another coincidence occurred. Equity markets in China started to crash and that contagion started to spread globally. Suddenly Gold was back on the radar as a safe haven store of value in times of turmoil.

Subsequently, we have seen Gold rally to the top of the bearish channel at $1170.00 before pulling back slightly to gather steam for the coming push. Technical analysis is providing some strong signals that a further bullish leg may be likely, as RSI trends strongly up and still remains within neutral territory. The moving averages are also spelling out a case for further gains as the 12 crosses bullishly over the 30EMA. However, price action remains somewhat stalled at the 38.2% Fibonacci level as it gathers the strength to push higher.
Ultimately, Gold will need to strongly break through the bearish trend line at $1170 if it has any chance of making significant gains. The signs are largely encouraging, especially given that the global nature of the equity collapse becomes apparent. Considering the ramifications to the U.S. economy that a sharp correction to stock markets poses, a large intervention by the Fed is a distinct possibility. Therefore, any move by either the central bank or the U.S. administration to stimulate the market could very well be a boon for gold.
If an intervention occurs, Gold bugs across the world will rejoice, as the yellow metal rises to prominence once again.
