Straight away let's acknowledge two things:
1) Gold has made a handsome start to the year, closing out January +3.4%, trading above the new year's eve low by as much as +8.4%, and having now recorded its fifth consecutive weekly "higher-high" price;
2) Gold at least technically looks poised to pull back, and as one study herein suggests, perhaps give back all of the young year's gains.
How's that for an opening, eh? Notably over the last two weeks we've seen Gold zoom along the runway and then climb high into the sky, indeed ascending up through 1279 yesterday (Friday) before gliding lower to settle the week at 1246. Again by the technicals, Gold may get a bit fraught near-term by turbulence before powering onto higher levels. Here we go.
Four weeks ago as 2014 commenced with Gold taking off like a rocket, we remarked that "one day does not a new year, nor its entirety make". And then, with respect to the S&P's stumbling out of the gate, we mentioned the old Wall Street saw of: "as goes opening day, so goes opening week, so goes January and thus so goes the year." With January now behind us and our crack staff able to readily whip out and sensibly assemble millennium-to-date data for these markets, let's assess the validity of January as an annual precursor of percentage performance.
Per the two-panel table below, with respect to the S&P on the left, the first 13 years of this Third Millennium indubitably brings to naught the old Wall Street saw as rot, fostered in the prior century by Wall Street wise guys, for annual direction has been correctly foretold by January in only one-half of the cases...
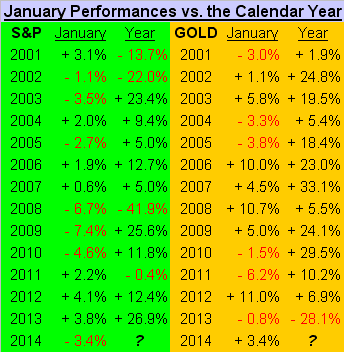
...whereas on the right for Gold, we find the January analysis to be clearly irrelevant. For irrespective of Gold's January journeys, it essentially always has an up year. Oh yes, it put in an abberative down year in 2013; however 12 up years in 13 (92%) is marvelously bullish, especially as price's foundational fundamental fuel (faux fiat fluff) fastidiously fabricates!
StateSide alone, the FOMC in its final chairing by Mr. Bernanke (I was incorrect in writing a week ago that 'twould be Ms. Yellen's first stint ... but does it really matter?) voted to pump $65 billion per month into the system, (which for you West Palm Beachers down there is $1 million 3,000 times per workday). Or by another measure, 'tis the annual GDP of the Central African Republic every day of the year!
The point is: January doesn't really give us a reliable clue as to the full year's performance. Its directional bent for the S&P is at best random and 'tis completely non-correlative for Gold, per the above table's history showing each year as up, (albeit with last year's wee -28.1% exception).
"Outrageous!" to refer to last year's Gold walloping as "wee"? Perhaps. Try this for wee: through it all, millennium-to-date the S&P (ex-dividends) at this writing is +35% and roughly 95% of the investing public own it in one form or another ... Gold meanwhile is +355% and yet at best only 5% of us own it. Now that's perspective. Wee indeed. "We the Gold People!"
Now before we get into the technical tip offs for some near-term turning lower, another month has passed and 'tis thus time to bring up the comparative year-over-year daily percentage tracks of Gold versus various of its paper versions. And for just this missive's particular presentation, we've added one "non-nugget" to the mix.
A couple a months ago a valued reader wrote in about something called NUGT. I'd nary a clue what this was, and indeed the first person to come to mind was one John Ascuaga, followed by rockin'-roller Ted "The Nuge" Nugent. As most of you know, I'm not really a stock-specific person, but the reader demonstrated to me that NUGT is quite the excessively-down exchange-traded fund (ETF) of some miners. Then this past week another reader wrote in about it. So I decided to give it a bit more due.
NUGT is the ticker symbol for something creatively called the "Direxion Daily Gold Miners Bull 3x Shares". Bull indeed. Since its inception in 2011, this thing's gone from as high as 2,182 to its present level of 37. That's a whack of -98%. We report, you run and hide. Here 'tis year-over-year-to-date along with Gold itself, the HUI Gold Bug's Index, the XAU Philly Precious Metals Index, the more stable ETF for the miners (GDX), and good old Royal Gold (RGLD), the latter of which lately has out-paced 'em all to the upside...
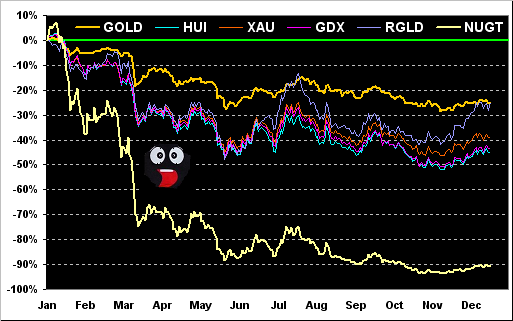
...proving yet again why my preference rests with the quiet sanctity, reserved if not outright boring trade, of Gold itself. As for NUGT: that's NUTS!
So now we turn to the technicals: may their imminent negativity be defied by the fundamental gods and thereby drive Gold higher into February! Oh where is The Sybil when in earnest we seek her presence and upward guidance...

Ah. Not bad. Nor is the price pattern itself. Clearly Gold's trend ascends year-to-date and there's plenty of room between the current 1246 level and the parabolic 1185 level (61 points) to maintain such weekly Long trend whilst allowing for some retrenchment, which despite the over-watch of The Sybil, is now being foretold by the technicals.
Let us begin with the "Baby Blues" as they define the consistency of Gold's 21-day linear regression trend. Here are those blue dots and daily price bars for the past three months-to-date:
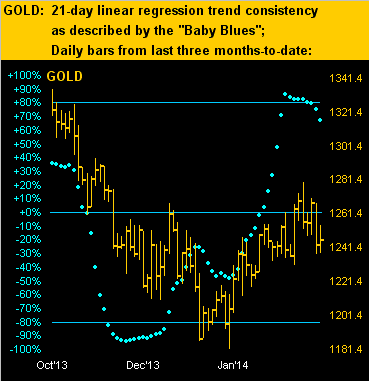
The Baby Blues having fallen through the +80% horizontal line in the above chart is an early red flag that the trend -- which remains up given the blue dots being well above the 0% axis-- is nonetheless beginning to break apart. 'Tis worth keeping an eye on this chart as updated daily at the website.
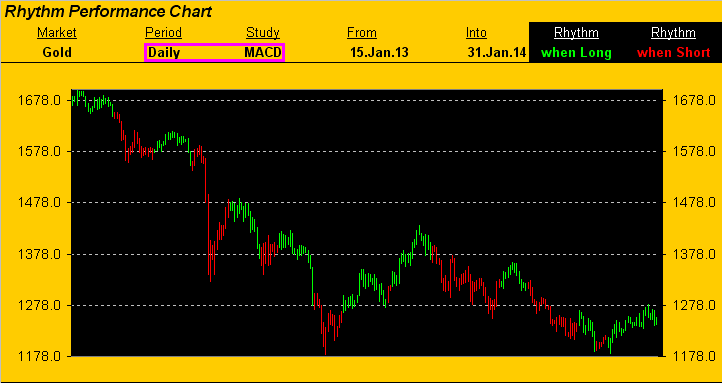
Now here is where it gets a bit more daunting. Two of Gold's "dependable in hindsight" Market Rhythms are rooted in the following studies.
First is Gold's measure of moving average convergence divergence (MACD) for the daily bars. The chart below of those bars from better than a year ago into yesterday, (without displaying the actual MACD study itself), simply denotes Gold's price track as green when the MACD is positively disposed, else red when negatively so. And come Monday, should Gold settle below 1235.8, those bars will change from currently being green to red. And as is noted on our Market Rhythms page, 8 of the last 10 crossings of the MACD either from positive to negative, or vice versa, have shown price to have followed-through in the same direction by at least 27 points, ($2,700 per contract). Therefore: should Gold settle sub-1236, we'd "expect" to see at least 1209 trade in the ensuing days or weeks upon such negative MACD crossing being confirmed, (or if not Monday, a similar downside distance from whatever price happens to be upon the next confirmed negative MACD crossing):
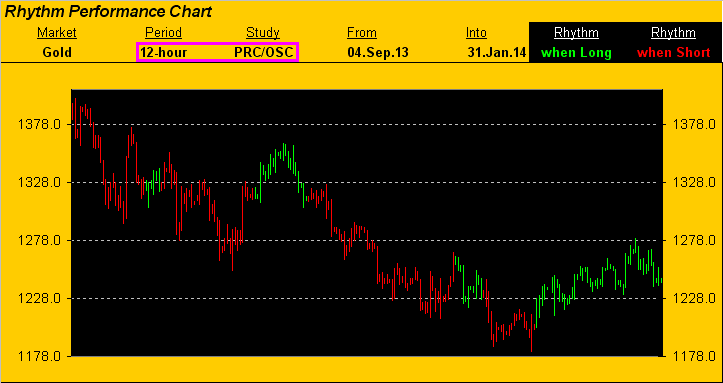
Second, and even more daunting when calculating our Market Rhythm expectations, is Gold's "price oscillator" study on the 12-hour bars. (Whereas MACD studies, given their popularity, are widely displayable for stocks and futures at charting websites, the price oscillator study is more peculiar to technical software packages. Its calculation is similar to that of MACD, and you can find numerous descriptions of it online). Sufficient to our presentation here, the graphic below of Gold's 12-hour bars from last 04 September into yesterday engages the same logic wherein if the price oscillator is positive, the bars are green, otherwise they are red. And come tomorrow (Sunday) when trading for the new week commences, the bars will change to red. And why the use of the word "daunting"? In 5 of the last 6 colour changes, irrespective of direction, price per this study has followed-through by at least 44 points ($4,400 per contract), which from the current price of 1246 would bring 1202. At what price did Gold open the year? 1204. Ouch. The would certainly bring the nervous nellies to the fore for a bit, (not to mention those annoyingly negative nattering nabobs). We therefore hope the recent Market Rhythm history of the price oscillator study does not repeat itself in this imminent instance:
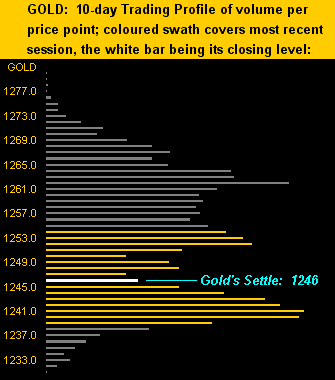
Moreover, such near-term tendency of technical negativity obviously puts Gold's trading support level of 1241 at risk. Here's the current profile:
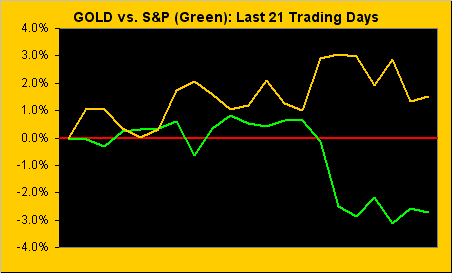
Thus having scared the bulk of you off, let's nevertheless accentuate a couple of positives. As presented at the outset, Gold is +3.4% in the new year whilst the S&P is off the equivalent -3.4% The exciting bit -- and this is really important -- is that Gold is in play: 'tis no longer being disregarded as entirely was the case throughout last year. A lot of genuinely renewed interest has come back to Gold in kicking off 2014 and the imminent negativity that we technically expect ought be then met with far more buying vigor than we saw, if at all, during 2013. Add to that our continuing to be on "crash watch" for the S&P, its inverse correlation to Gold therefore more broadly making the yellow metal bold:
Another positive is with respect ironically to all this suddenly newfound "Dollar strength" running rife within the FinMedia, given emerging markets coming unglued, Argentinian currency devaluation, Turkish rate spikes, et alia. Dollar schmaller. Let's have a focused look at the Dollar as measured by the Dollar Index and then bring Gold into the mix.
The Dollar Index is currently at 81.370. Rounding that level to the nearest tenth gives us 81.4. "Dollar strength!" they say. Ok. Let's count every session since 06 October 2008, at which time the Black Swan was bombarding the markets, through yesterday, wherein the Dollar Index has settled at that rounded level of 81.4 -- 14 times. Now: what is the average price of Gold's settles for those same 14 occurrences? 1419.
"So Gold right now is 173 points too low, mmb?"
On an averaged basis, 'tis the notion, Squire. Moreover the chart below of the Dollar Index over that 1,340-session time frame with its linear regression line rightly shows the trend as down, in spite of price being the same today as it was back on that noted date in '08...
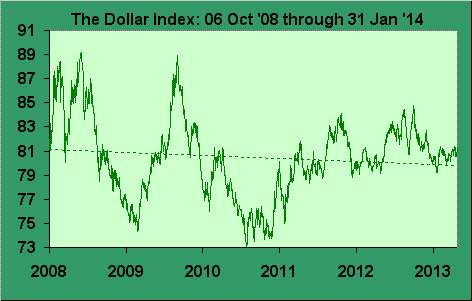
...and yet there's 39% more Fed fiat M2 today than there was then! In the perfect vacuum, one might opine that the Dollar Index today ought thus be only around 49. But oh that Dollar strength! Of course such logical demise is offset by all the other debasing going on 'round the world. However: ballooning currencies are only bounded by the strength of their respective elasticities. And in the broadest sense, 'tis lovely at the end of the day that Gold plays no currency favourites!
To be sure, 'tis all quite a lot to digest, so cinch that seatbelt up a notch as Gold may well hit an air pocket or two through here. But methinx at best 'twill be a temporary tiff.