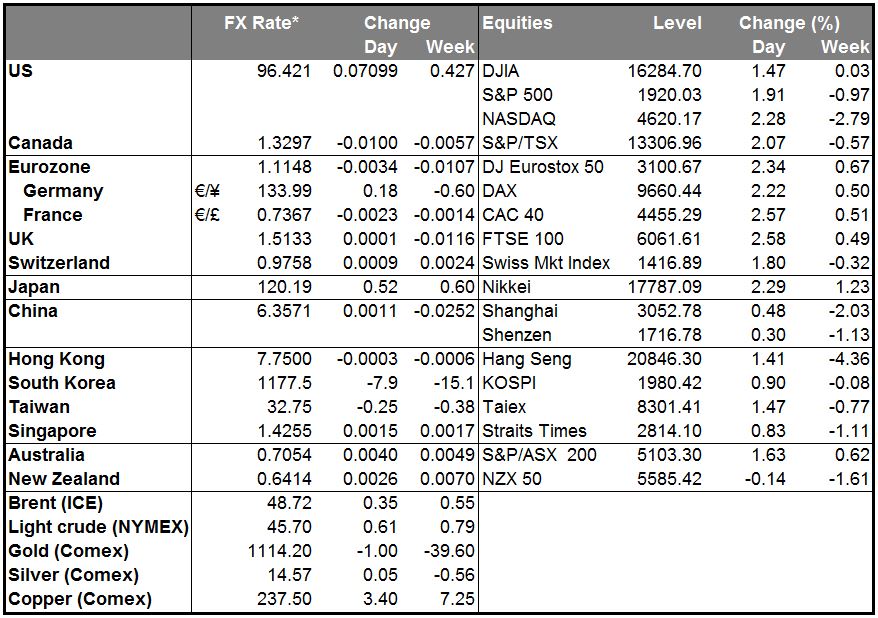
• China PMI: it could’ve been worse Markets breathed a sigh of relief this morning as the China manufacturing PMIs for September showed that things weren’t any worse than expected. The official manufacturing PMI for the month came in at 49.8, a bit higher than expected (expected: 49.7, same as in August), while the final Caixin manufacturing PMI for the month was revised up slightly to 47.2 from the initial 47.0 (previous: 47.3). The indices therefore show continued deterioration, given that they are both below 50, but there’s some relief that at least the speed of deterioration is not accelerating. There’s also some hope that yesterday’s relaxation of minimum down payment requirements for some cities in China may help to support the Chinese construction industry, which is probably the most important single sector in the world.
• The indications of stabilization encouraged investors and risky assets were doing well this morning. All Asian stock markets were higher, as were AUD and NZD.
• Note: Markit announced that it was discontinuing the flash estimate of the Caixin/Markit China PMI every month. The official indicator will still be announced on the first business day of the following month, along with the other global PMIs.
• Japan tankan disappointing for manufacturers The Bank of Japan’s quarterly Tankan business confidence survey for Q3 showed that confidence among large manufacturers was even worse than expected. The diffusion index (DI) for large manufacturers fell more than expected, and expectations for Q4 are that it is likely to be even lower. Large non manufacturers on the other hand showed an improvement in their attitude, although they too expected things to be worse in Q4. Given the key role that manufacturers still play in the Japanese economy, the results show the need to keep the yen weak to support exports. The figure is JPY negative, although my guess is that today’s movement has more to do with the China PMI, which pushed stocks up and dragged USD/JPY higher too, than with the tankan.
• Canada’s GDP surprises on the upside Canada’s GDP in July rose 0.3% mom, beating expectations of 0.2% growth. The rise was driven by sharply higher “non conventional oil extraction” as production recovered from seven straight monthly declines. That suggests Q3 GDP as a whole is likely to rebound, ending two consecutive quarters of contraction. With the economy rebounding, the Bank of Canada is less likely to lower interest rates further and the market is now pricing in only a small chance of any easing in the next year. CAD could gain further as investors trim their extremely short positions in the currency, but with oil prices likely to weaken further (in my view), I remain bearish on the currency over the medium term.
• Today’s highlights: During the European day, the final manufacturing PMI figures for September from several European countries, and the Eurozone as a whole are also coming out. As usual, the final forecasts are the same as the initial estimates, thus the market reaction on these news is usually limited, unless we have a huge revision from the preliminary figures. UK manufacturing PMI for September is forecast to decrease a bit, which could prove GBP negative.
• From Canada, we get the RBC manufacturing PMI for September. Market pays more attention to the Ivey PMI to be released next week. Thus, the reaction is usually limited at the release.
• In the US, the ISM manufacturing PMI and the final Markit manufacturing PMI, both for September, are also due out. The ISM index is expected to decline slightly but to stay above the 50 level, but that seems unlikely to me. All of the Fed’s regional PMIs are in contractionary territory, so I think wonder if the national PMI can still be in expansionary territory. There could be some disappointment in today’s ISM that would weaken the dollar.
• Initial jobless claims for the week ended Sep. 25 is also coming out.
• As for the speakers, Atlanta Fed President Dennis Lockhart and San Francisco Fed President John Williams speak. Both men have spoken recently and so no surprise is likely. Lockhart last spoke on Sep. 23rd, when he said the decision to keep rates on hold was “risk management” and that normalization will signal a healthier economy. Williams spoke on Tuesday and he saw the normalization process starting this year.
The Market
EUR/USD breaks below 1.1200
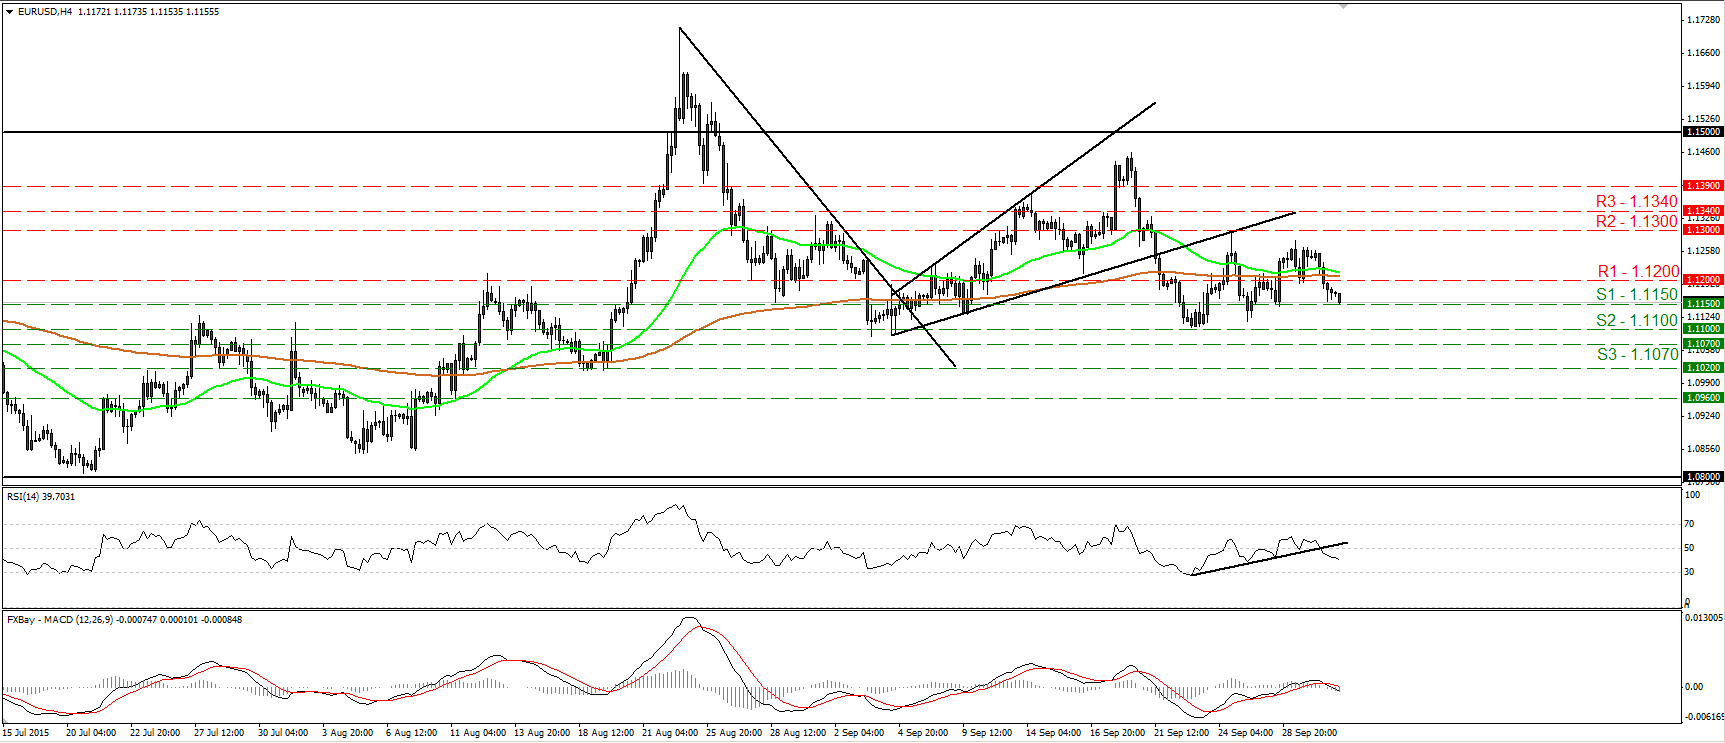
• EUR/USD traded lower on Wednesday, breaking below the support (now turned into resistance) line of 1.1200 (S1). The decline was halted by the 1.1150 (S1) barrier, where a clear break is likely to open the way for our next support at 1.1100 (S2). Taking a look at our momentum studies, the RSI fell below its 50 line and below its upside support line. It now points south. The MACD has topped slightly above zero and crossed below both its zero and signal lines. These indicators detect negative momentum and amplify the case that EUR/USD could fall below the 1.1150 (S1) support line. In the bigger picture, as long as EUR/USD is trading between the 1.0800 key support and the psychological zone of 1.1500, I would hold a flat stance as far as the overall picture is concerned. I would like to see another move above 1.1500 before assuming that the overall outlook is back positive. On the downside, a break below the 1.0800 hurdle is the move that could shift the picture negative.
• Support: 1.1150 (S1), 1.1100 (S2), 1.1070 (S3)
• Resistance: 1.1200 (R1), 1.1300 (R2), 1.1340 (R3)
GBP/JPY rebounds from near 181.00
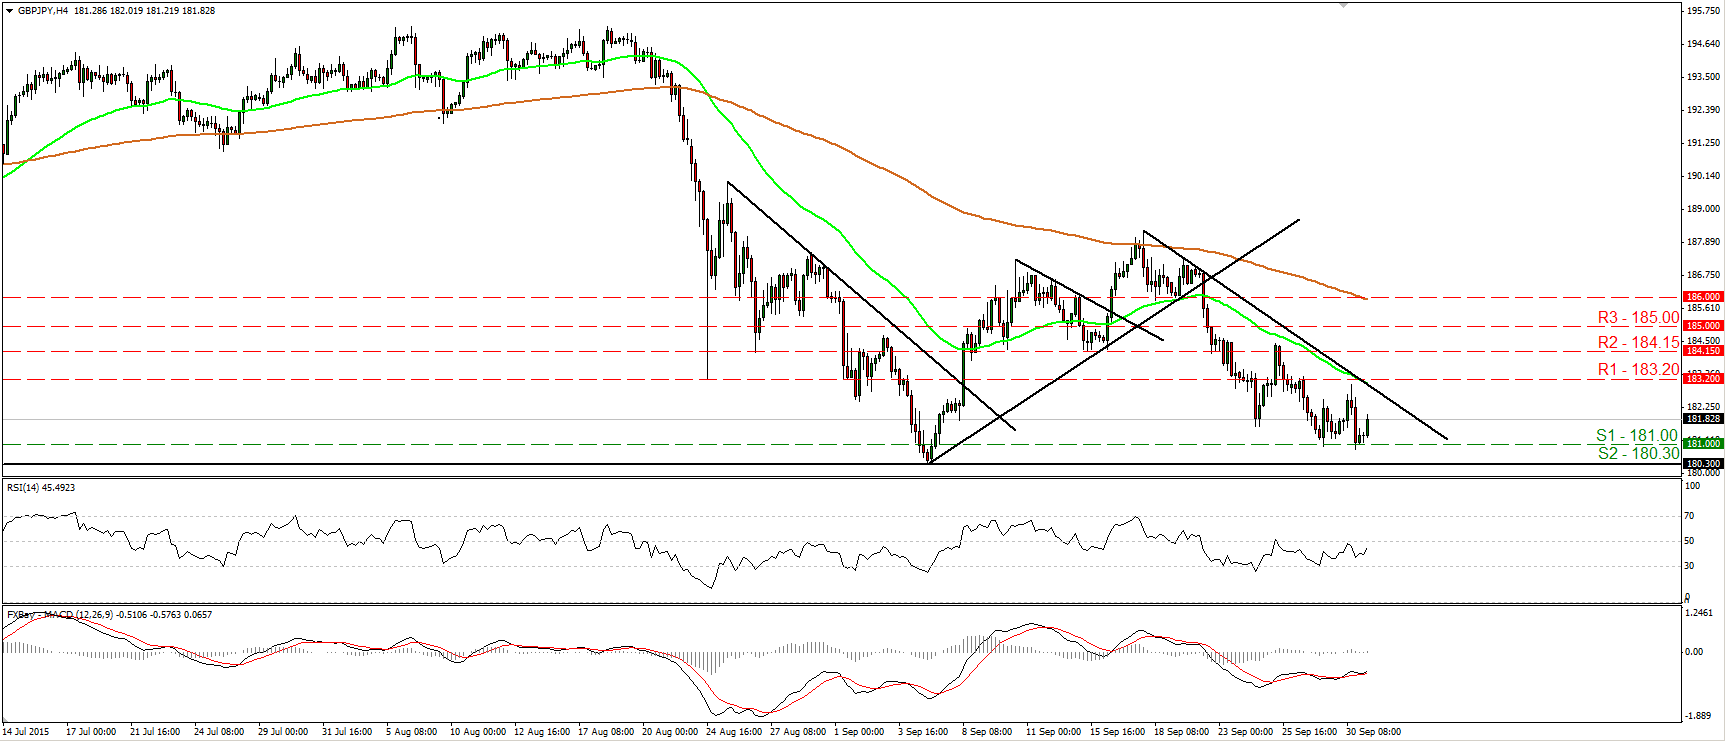
• GBP/JPY traded lower yesterday, but hit support fractionally below 181.00 (S1) and today during the Asian morning it rebounded. Although the short term trend looks to be negative, there is the possibility that the rebound may continue for a while, perhaps to challenge the black downtrend line or the 183.20 (R1) resistance hurdle. This is also supported by our short term oscillators. The RSI turned up again and looks to be headed towards its 50 line, while the MACD, although negative, rebounded from near its trigger line and is now pointing north. There is also positive divergence between both these studies and the price action. On the daily chart, given the completion of a double top pattern on the 24th of August, I would consider the medium term path to be cautiously negative. I would treat any further near term advances as corrective moves before the bears decide to shoot again.
• Support: 181.00 (S1), 180.30 (S2), 180.00 (S3)
• Resistance: 183.20 (R1), 184.15 (R2), 185.00 (R3)
AUD/USD breaks above 0.7040
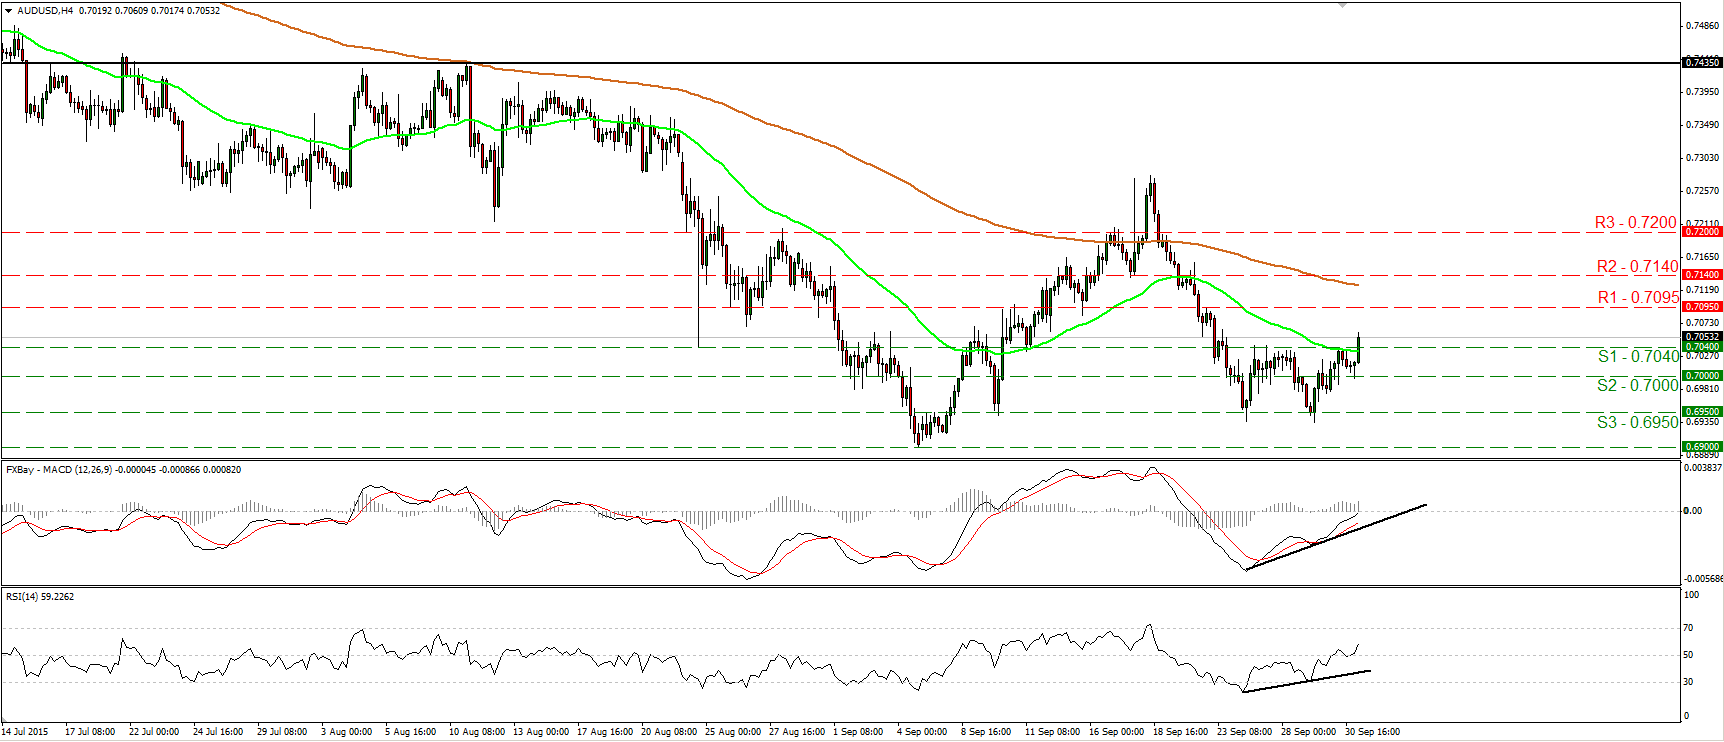
• AUD/USD hit support at 0.7000 (S2) and today during the Asian morning it traded higher and managed to break above the 0.7040 (S1) obstacle. The break above 0.7040 (S1) signaled the completion of a short term double bottom formation and confirmed the positive divergence between both our short term oscillators and the price action. Therefore, I would expect the bulls to pull the trigger for the 0.7095 (R1) resistance obstacle. The RSI rebounded from near its 50 line and is now pointing up, while the MACD, although negative, stands above its trigger line and could turn positive soon. Plotting the daily chart, I still see a major downtrend. However, the fact that the rate looks able to print a higher low near 0.6950 (S1) is the reason I would stay flat for now with regards to the broader trend.
• Support: 0.7040 (S1), 0.7000 (S2), 0.6950 (S3)
• Resistance: 0.7095 (R1), 0.7140 (R2), 0.7200 (R3)
Gold falls below 1121
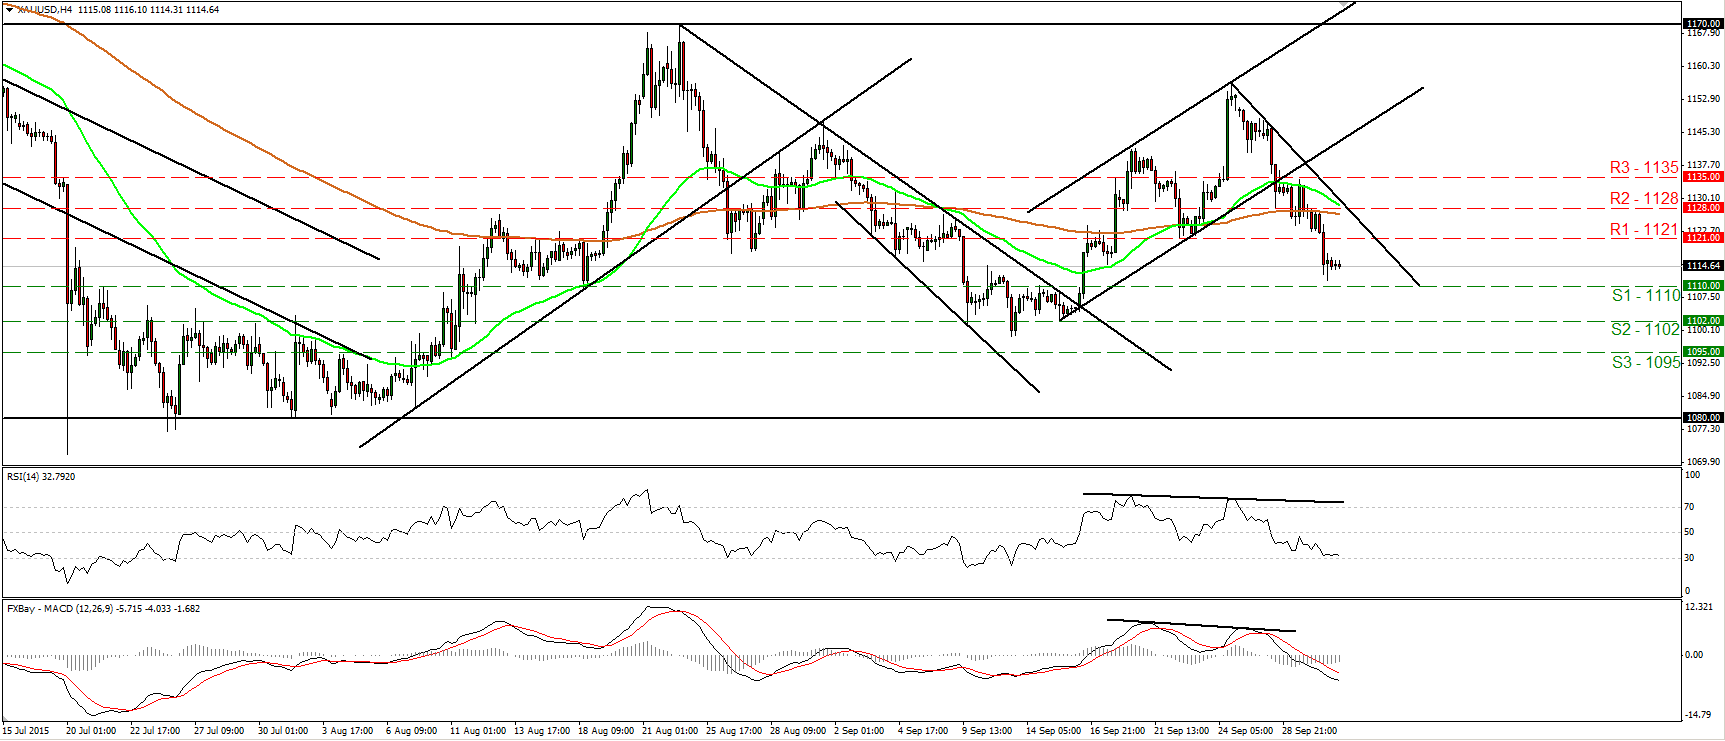
• Gold continued trading lower on Wednesday, and managed to fall below the support (now turned into resistance) hurdle of 1121 (R1). The decline was stopped slightly above the 1110 (S1) barrier. The short term bias remains negative in my view and therefore, I would expect a break below 1110 (S1) to set the stage towards the next support at 1102 (S2). Our short term oscillators detect downside speed and support the negative near term outlook. The RSI edged lower after it hit resistance slightly below its 50 line and now appears ready to fall below its 30 line, while the MACD lies below both its zero and signal lines. As for the bigger picture, with no clear trending structure on the daily chart, I would hold my neutral stance as far as the overall outlook is concerned. I believe that a close above 1170 is needed to signal a newborn medium term uptrend.
• Support: 1110 (S1), 1102 (S2), 1095 (S3)
• Resistance: 1121 (R1), 1128 (R2), 1135 (R3)
DAX futures hit again support at 9315 and rebound
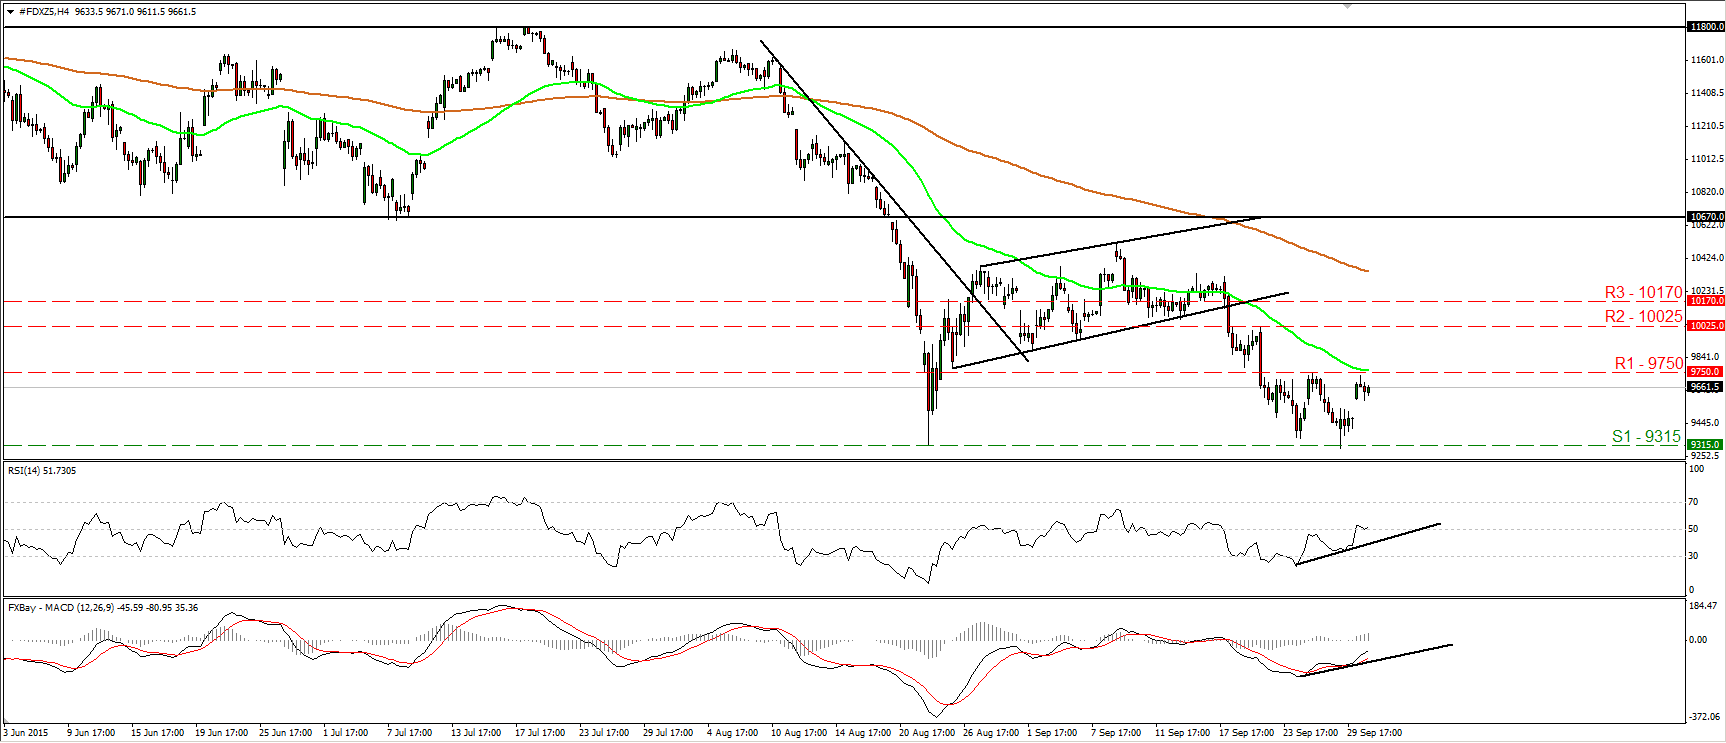
• DAX futures once again hit support at the 9315 (S1) barrier and rebounded to challenge the resistance of 9750 (R1). Given the inability of the bears to overcome the 9315 (S1) support obstacle, I see the likelihood for the positive wave to continue for a while. A clear break above 9750 (R1) could signal the completion of a short term double bottom formation and perhaps open the way for the next resistance at 10025 (R2). Our near term oscillators support the notion as well. The RSI rebounded from near its 50 line, while the MACD, although negative, lies above its trigger line. What is more, there is positive divergence between both these indicators and the price action. On the daily chart, the break below 10670 on the 20th of August has shifted the medium term outlook to the downside, in my view. Therefore, I would treat the 24th of August to 9th of September recovery as a corrective phase and I would expect the index to extend its declines.
• Support: 9315 (S1), 9130 (S2), 9000 (S3)
• Resistance: 9750 (R1) 10025 (R2), 10170 (R3)

