The Market
EUR/USD breaks above 1.1500 and hits resistance slightly below 1.1725
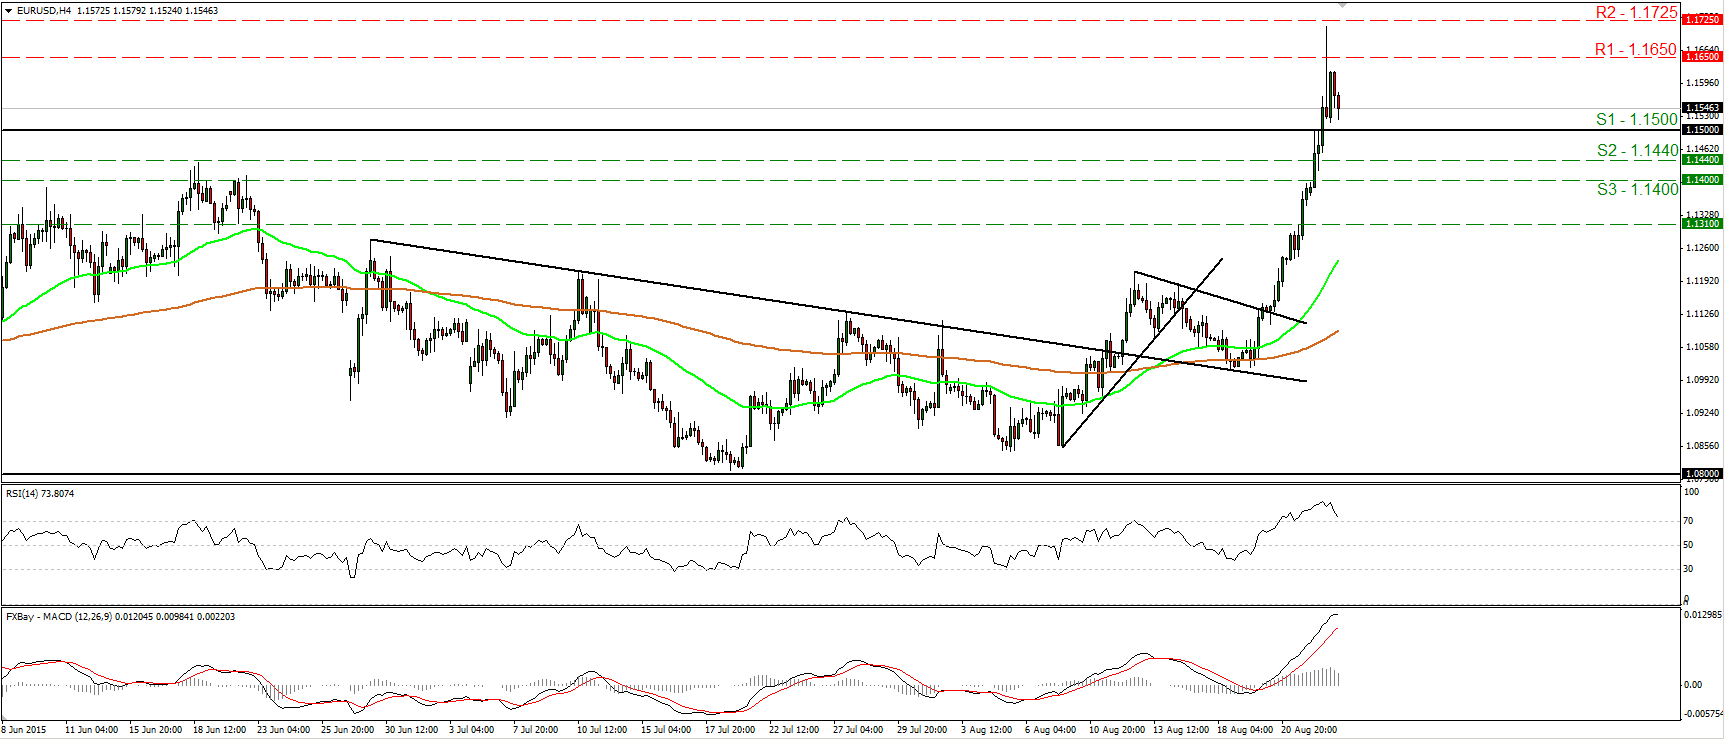
• EUR/USD continued its crazy rally yesterday, breaking above the psychological round barrier of 1.1500 (S1). Nevertheless, the surge was halted slightly below our resistance of 1.1725 (R2) and subsequently, the rate retreated. The price structure on the 4-hour chart still suggests a short-term uptrend. As a result, I would expect another break above 1.1650 (R1) to reach the 1.1725 (R2) hurdle this time. Taking a look at our oscillators though, I see signs that further pullback could be in the works before the bulls seize control again, perhaps even below 1.1500 (S1). The RSI has topped within its overbought zone and now looks ready to fall below 70, while the MACD has topped and could fall below its trigger line soon. As for the broader trend, EUR/USD had been trading between 1.0800 and 1.1500 (S1) from the 23rd of April until yesterday. Yesterday the rate managed to close above 1.1500 (S1), something that probably signals the exit of the aforementioned sideways range, and turns the overall outlook positive.
• Support: 1.1500 (S1), 1.1440 (S2), 1.1400 (S3)
• Resistance: 1.1650 (R1), 1.1725 (R2), 1.1790 (R3)
GBP/USD hits resistance at 1.5800
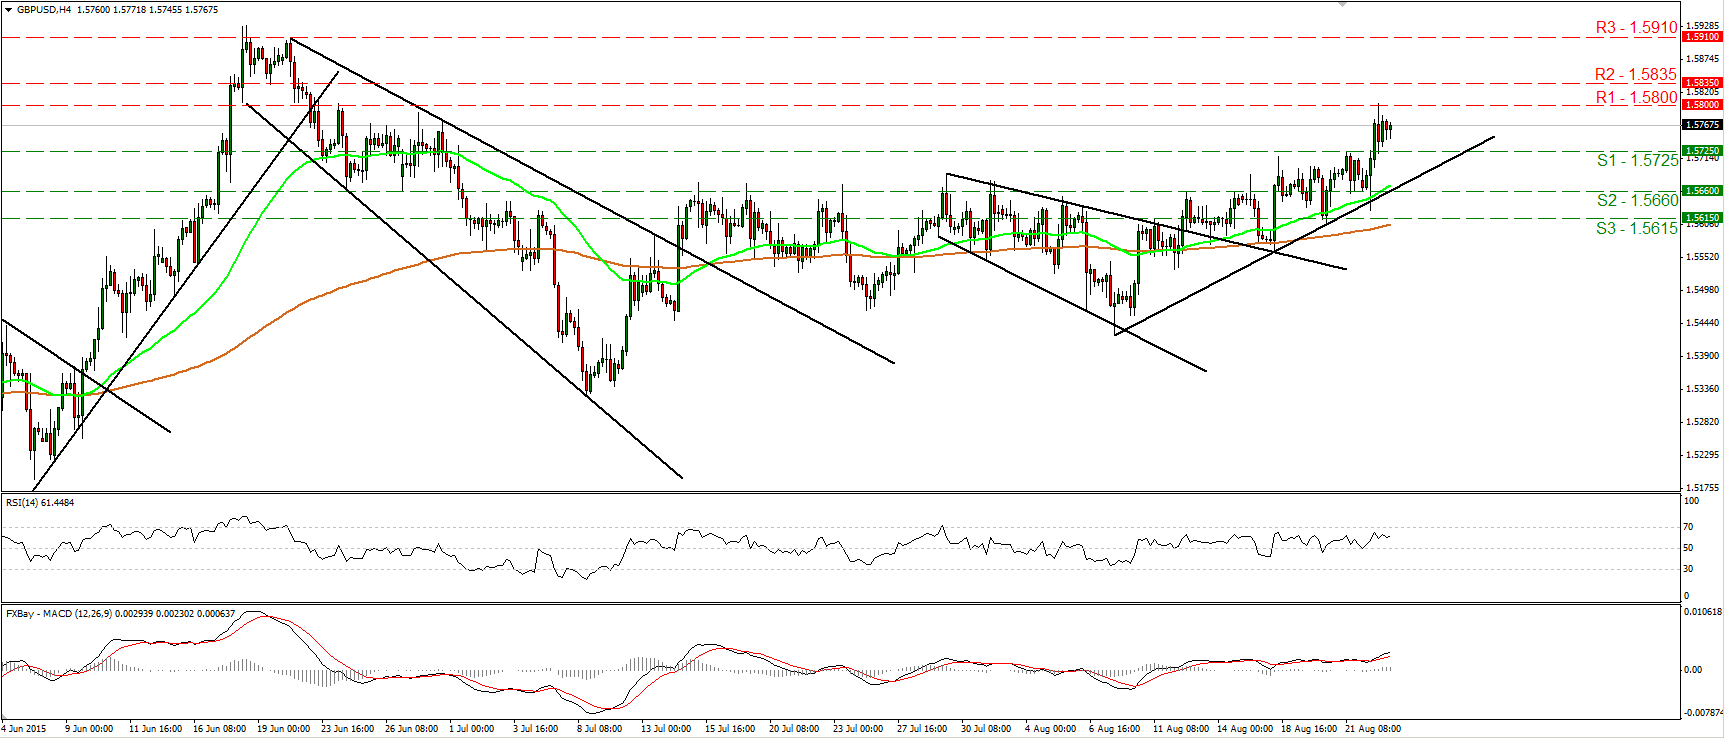
• GBP/USD traded higher on Monday, breaking above the resistance (now turned into support) barrier of 1.5725 (S1) and hitting resistance near the 1.5800 (R1) line. As long as the pair is trading above the uptrend line taken from the low of the 7th of August, I would consider the short-term picture to stay positive. A move above 1.5800 (R1) is likely to initially target the 1.5835 (R2) line, while a break above the latter level could see scope for extensions towards the 1.5910 (R3) territory. Taking a look at our oscillators though, I see signs that a minor pullback is possible before the next positive leg. The RSI edged somewhat down after finding resistance slightly below its 70 line, while the MACD, although positive, shows signs that it could start topping. As for the broader trend, the price structure on the daily chart still suggests an uptrend. What is more, cable is still trading above the 80-day exponential moving average. Therefore I would expect the rate to continue trading higher in the foreseeable future.
• Support: 1.5725 (S1), 1.5660 (S2), 1.5615 (S3)
• Resistance: 1.5800 (R1), 1.5835 (R2), 1.5910 (R3)
USD/JPY rebounds from slightly above 116.00
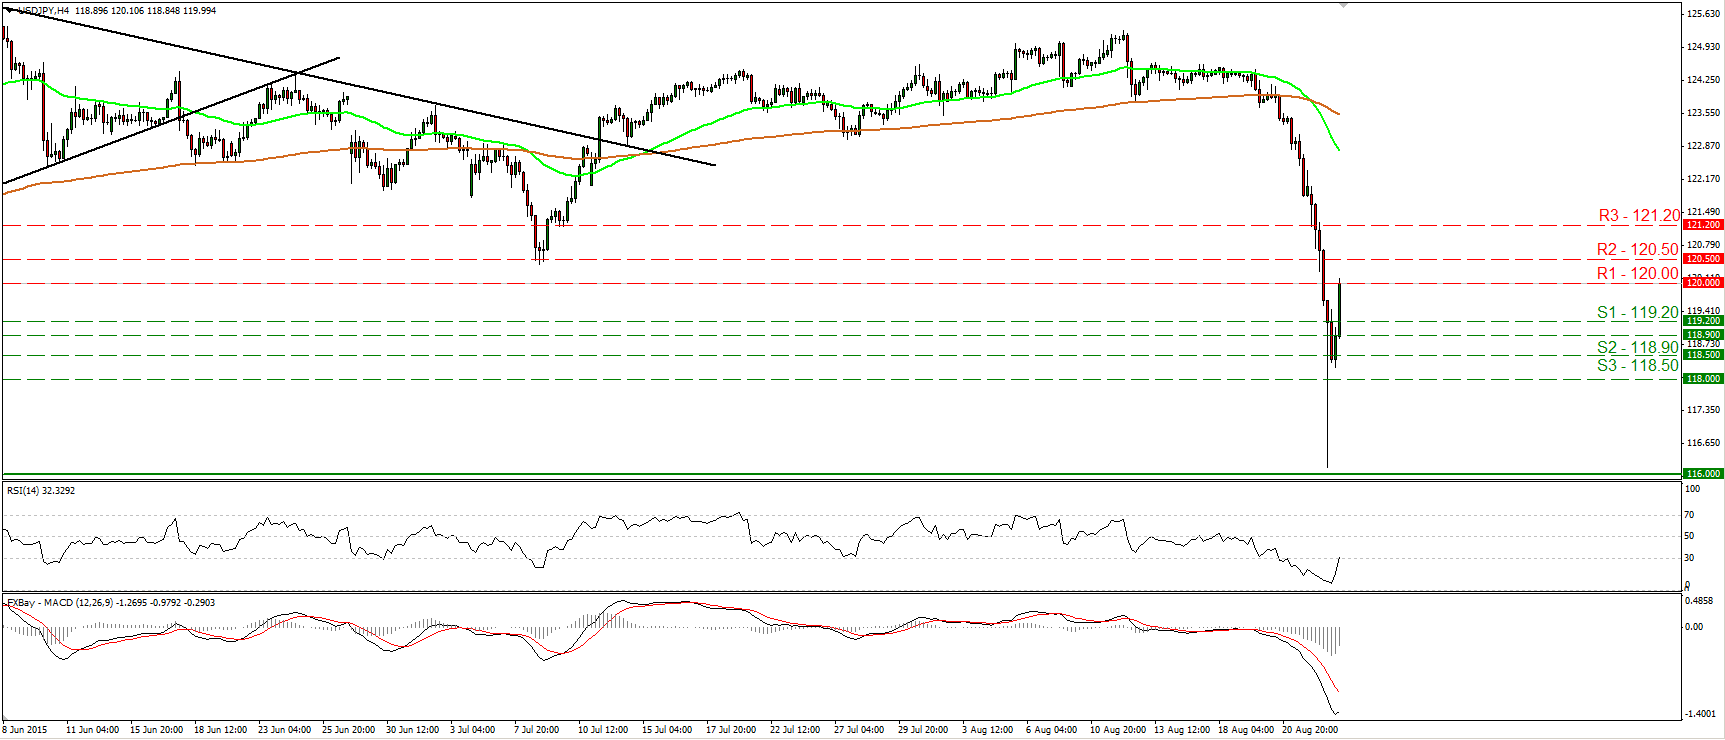
• USD/JPY continued collapsing yesterday, but triggered some buy orders slightly above the 116.00 barrier and rebounded to reach the psychological zone of 120.00 (R1). The short-term trend remains negative in my view, but I see signs that the rebound may continue for a while. A break above 120.00 (R1) could initially aim for the next resistance at 120.50 (R2). Our short-term oscillators support the notion as well. The RSI just exited its below-30 territory, while the MACD has bottomed and could move above its trigger line in the near future. As for the broader trend, yesterday’s plunge signaled the completion of a possible double top formation, which probably shifted the medium-term picture negative as well. As a result, I would treat any possible near-term advances as a corrective phase for now.
• Support: 119.20 (S1), 118.90 (S2), 118.50 (S3)
• Resistance: 120.00 (R1), 120.50 (R2), 121.20 (R3)
Gold stays between 1150 and 1168
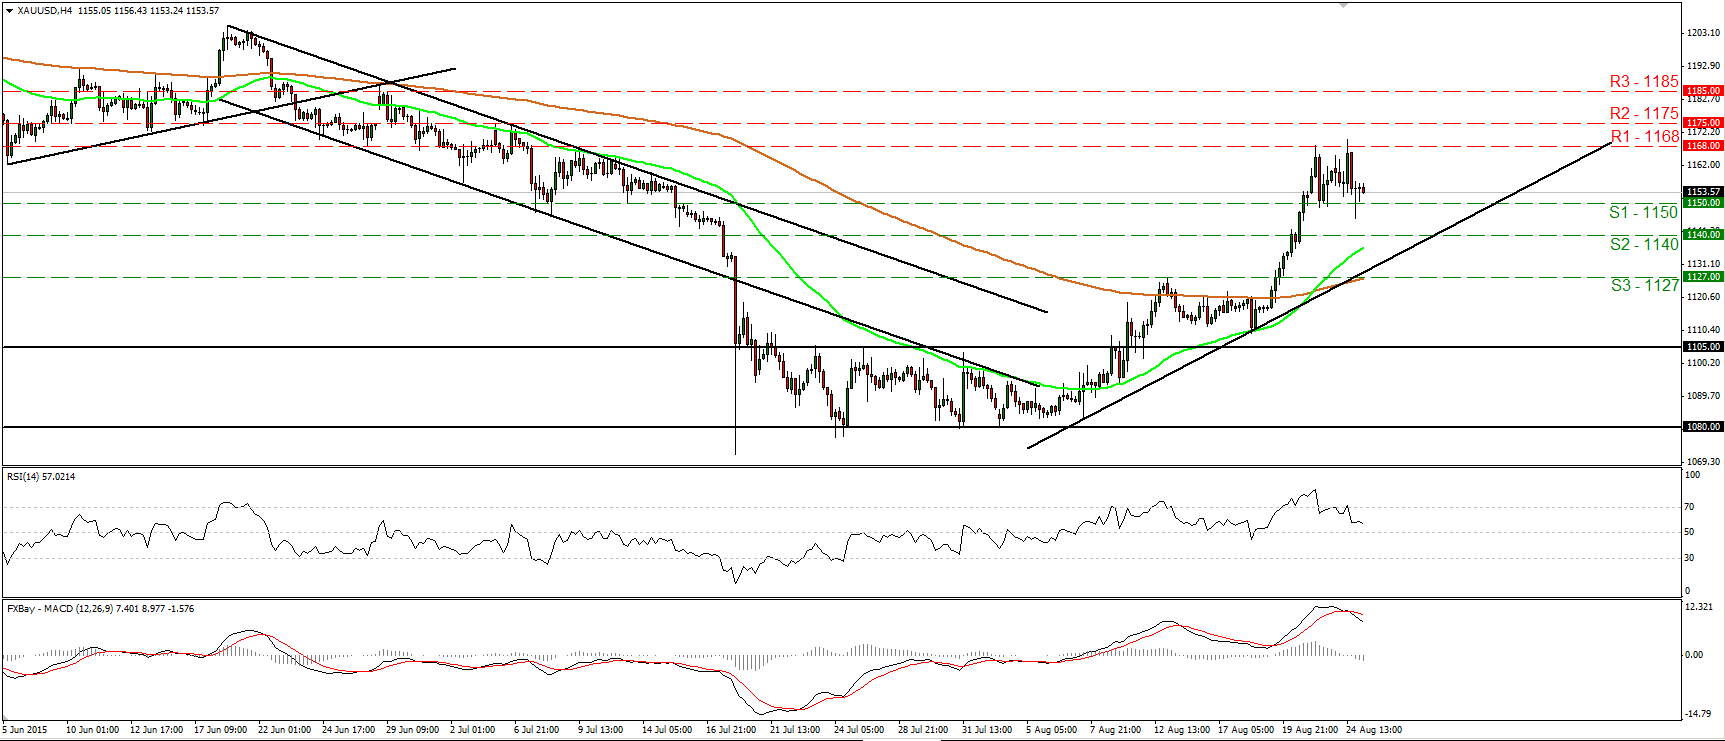
• Gold traded in a consolidative manner o Monday, staying between the support of 1150 (S1) and the resistance of 1168 (R1). The short-term picture is still positive in my opinion and as a result, I would expect a move above 1168 (R1) to initially target the 1175 (R2) hurdle. Nevertheless, our momentum indicators give evidence that a setback could be looming before the next positive leg. The RSI exited its above-70 territory and continued lower, while the MACD has topped and fallen below its trigger line. As for the bigger picture, having in mind that Thursday’s rally brought the metal above the downside resistance line taken from the peak of the 18th of May, I would switch my stance to neutral as far as the overall picture is concerned.
• Support: 1150 (S1), 1140 (S2), 1127 (S3)
• Resistance: 1168 (R1), 1175 (R2), 1185 (R3)
WTI hits support at 37.80 and rebounds
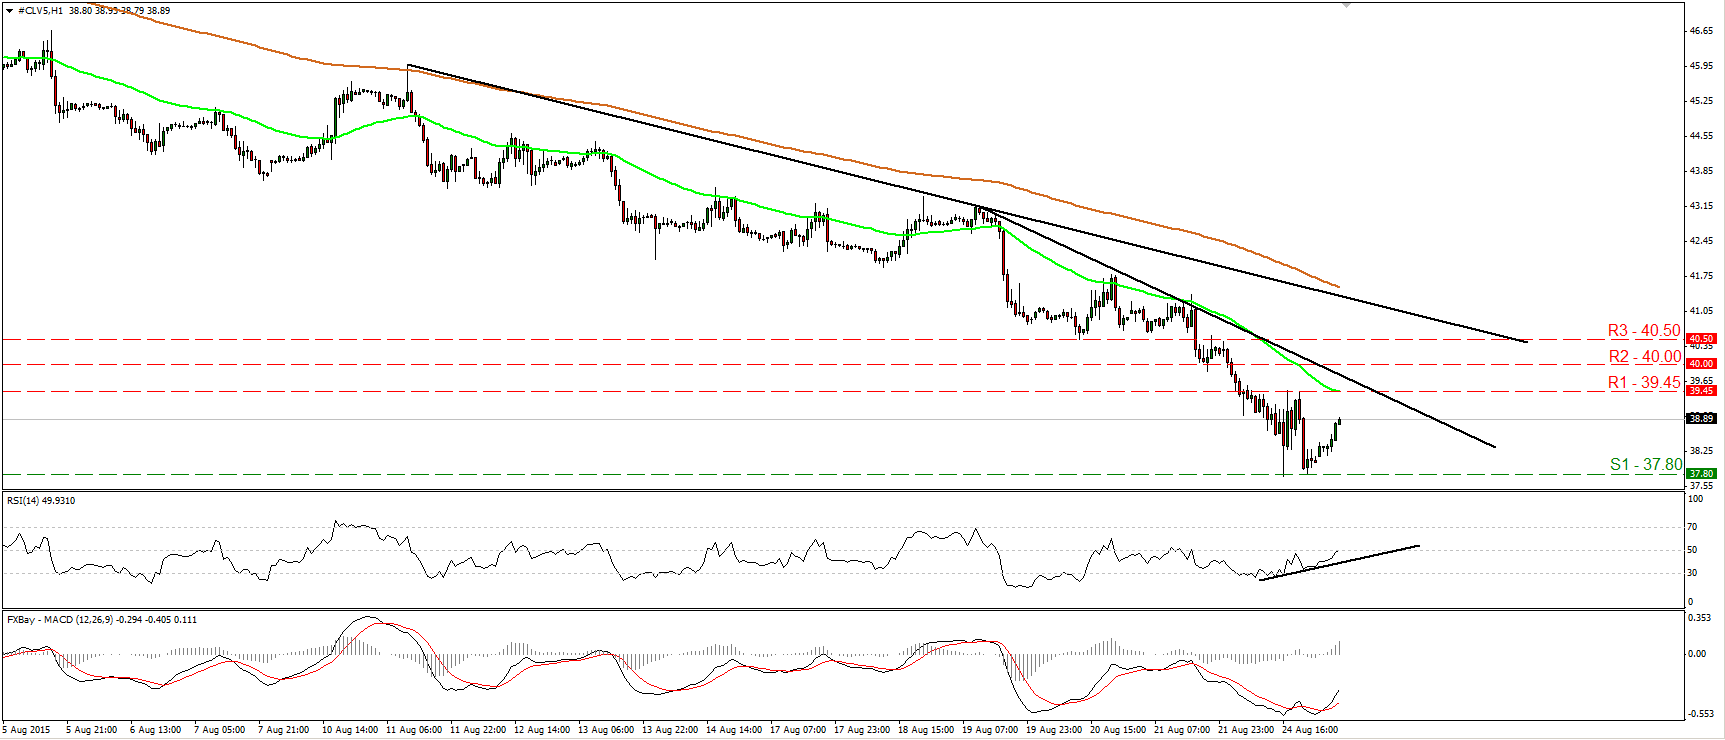
• WTI traded lower yesterday, but hit support at 37.80 (S1) and then it rebounded. The short-term trend remains negative in my view, and therefore I would expect the bears to take in charge at some point and push the rate down for another test at the 37.80 (S1) barrier. But for now, our oscillators give evidence that the current rebound may continue for a while. The 14-hour RSI edged higher and now looks ready to move above its 50 line, while the hourly MACD has bottomed and crossed above its trigger line. Moreover, there is positive divergence between the RSI and the price action. On the daily chart, the price structure has been lower peaks and lower troughs since the 24th of June. Therefore, I would see a negative longer-term picture as well.
• Support: 37.80 (S1), 37.00 (S2), 36.00 (S3)
• Resistance: 39.45 (R1) 40.00 (R2), 40.50 (R3)

