What would you do if you lived in Greece?
The Greek government Monday decreed that state bodies, with the exception of pension funds, must transfer their reserves to the Bank of Greece for the state’s use. “State bodies” includes everything from hospitals to local governments. Estimates are that the move will provide EUR 1.2bn to EUR 2bn, which should allow the government to pay civil servants’ salaries and pensions this month. The government is then hoping that a Eurogroup summit on May 11 will release EUR 1.9bn in profits from Greek bonds held by the Eurosystem. That would allow the government to meet a EUR 747mn payment due to the IMF the following day. Nonetheless, with EUR 2.8bn in maturing T-bills during the month, things will still be tight during May. And the June debt repayment schedule is even heavier.
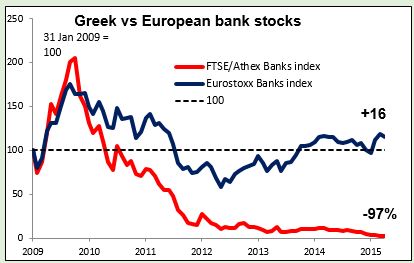
The problem though as I see it is the populace’s reaction to the move. On the one hand, regional authorities were said to be planning legal action against the decree. At the same time, ordinary citizens may see this as the first step towards capital controls and confiscation of their bank accounts, as happened in Cyprus. What would you do with your money if you lived in Greece? I expect that this will simply hasten the outflow of funds from Greek banks and the collapse of the banking system. ECB Vice President Constancio yesterday noted that introducing capital controls in a country doesn’t mean that the country has to leave the euro, as the example of Cyprus shows – something that will hardly reassure the average Greek saver. To make matters worse, Constancio was not particularly supportive of the Greek banking system. “I cannot promise that we will fund Greece whatever the situation,” he said. He pointed out that the ECB’s rules allow it to supply funds only to banks that are solvent and have acceptable collateral. Just FYI, here are the share prices of several major Greek banks, with the prices at this time in 2009 – near the bottom of the Lehman Bros. collapse – in parenthesis. You can judge for yourself whether the market thinks these banks are solvent: o National Bank of Greece €1.00 (€54.59) o Alpha Bank €0.21 (€2.15) o Piraeus Bank €0.23 (€27.85)
The Greek situation seems to be heading towards a conclusion. Even if the market expects a successful conclusion, it has to price in at least the possibility of a disaster. I expect that possibility to weigh increasingly on the euro until the uncertainty is over.
AUD reverses AUD had a good day in the morning yesterday after China cut its reserve requirement ratio, but that proved to be the high point and the currency was the biggest loser among the G10 over the last 24 hours. RBA Gov. Stevens reminded people that further policy easing is “on the table” and said he thought AUD “will very likely fall further yet, over time.” To some degree this is only repeating what the RBA already said; the statement after its last meeting noted that “further easing of policy may be appropriate over the period ahead.” The market is already pricing in about a 75% chance of a rate cut at the RBA’s May meeting. Nonetheless, reminding everyone of this fact helped to weaken the currency. Later, the minutes of the recent RBA meeting were released. They omitted any reference to the currency being too high, but repeated the usual line about a further drop being likely because of the decline in commodity prices. I agree, especially as Chinese growth slows, and expect the AUD to weaken further. Note that Kaisa Group Holdings Ltd., a Chinese real estate developer, missed $52mn in interest payments yesterday. Who’s next?
Poloz is more confident about US than Dudley New York Fed President William Dudley was relatively cautious yesterday. He said he was “not reasonably confident right now” but that “hopefully” the data will support a rise in rates later this year. But he added that he thinks he will be “reasonably confident in the future”! Bank of Canada Gov. Poloz on the other hand was more optimistic about the US economy; he pointed to a strong US economy as the biggest risk to his forecasts. “The US economy has great fundamentals,” he said. In any event, the US policy divergence remains and should underpin the dollar going foreward.
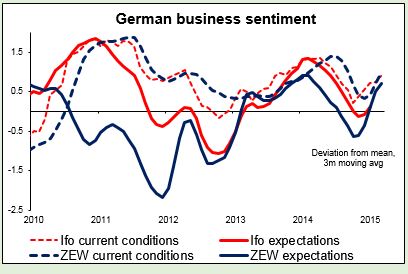
Today’s highlights: The calendar is relatively light today. During the European day, the main event will be the ZEW survey for April. Both the current situation and expectation indices have been climbing higher since November. This could be the 6th consecutive month of an increase, something that would confirm that Germany, Europe’s growth engine is gaining steam. In such an event, EUR/USD could rebound a bit but any bounces are likely to be short-lived and provide renewed selling opportunities. Eurozone’s debt-to-GDP for 2014 is also coming out.
In Sweden, official unemployment rate for March is coming out. The PES unemployment rate for March declined last week, but the two only move in the same direction 57% of the time so that may not imply much for the official rate. Nevertheless, even though the Riksbank doesn’t have a specific SEK rate in mind, the weak currency is needed to support the country’s economic recovery. Thus, we remain bearish on SEK.
As for the speakers, Riksbank Deputy Governor Henry Ohlsson and ECB’s Nouy speak; Canada's Finance Minister will deliver the government's long-delayed pre-election budget.
The Market
EUR/USD trades lower
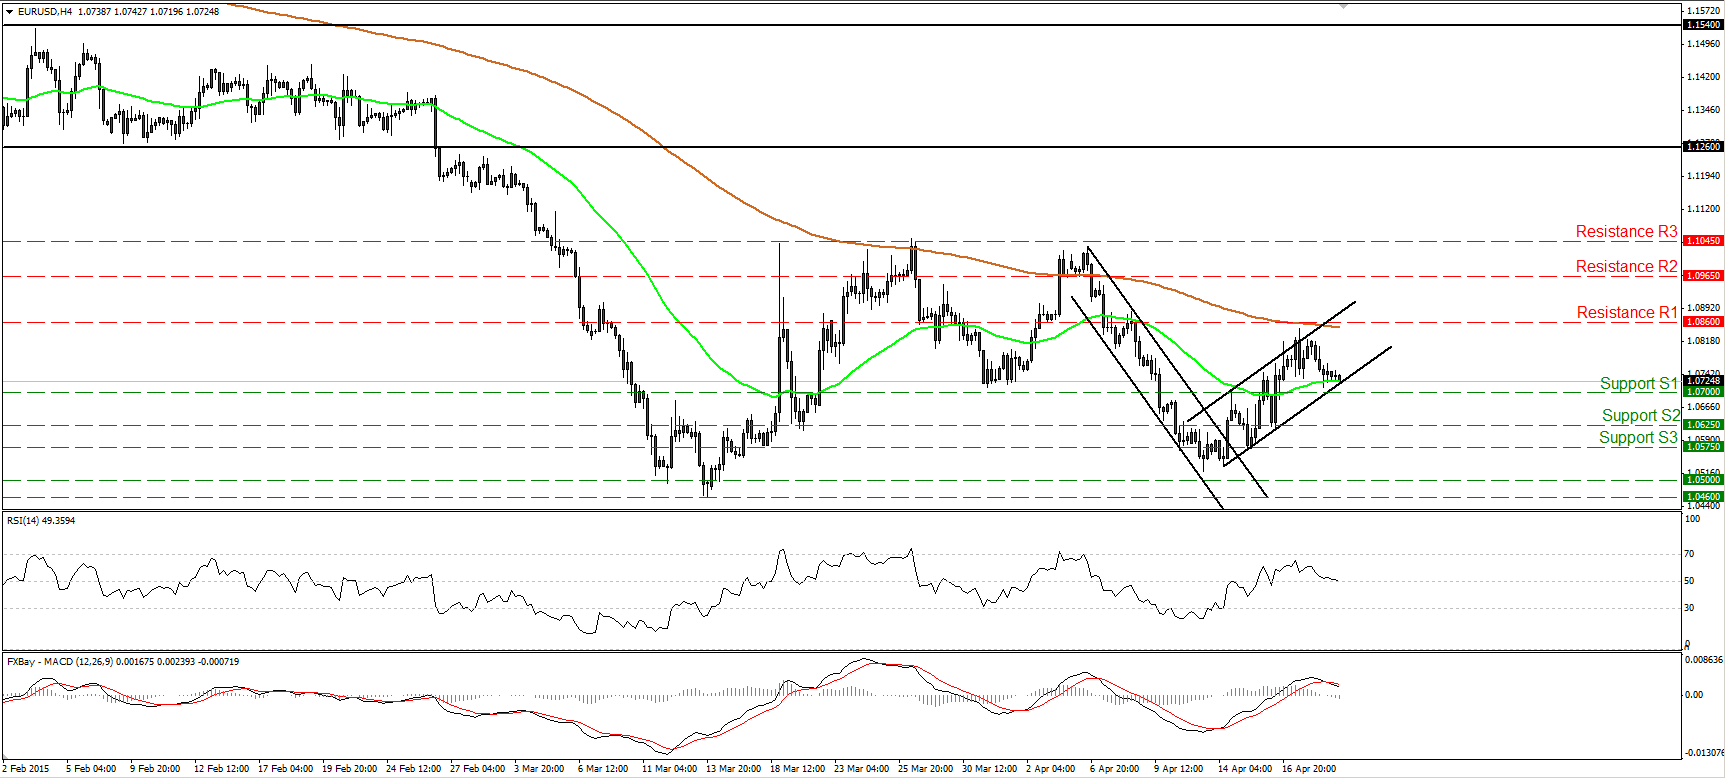
EUR/USD traded lower on Monday, but remained within the near-term upside channel. This keeps the near-term outlook somewhat positive, but bearing in mind our momentum indicators, I would prefer to stand aside for now. The RSI moved lower and now looks ready to cross below its 50 line, while the MACD, although positive, has turned down and fell below its signal line. These signs suggest that yesterday’s decline may have not come to an end yet. In the bigger picture, EUR/USD is still trading below both the 50- and the 200-day moving averages. However, a clear close below 1.0460 is needed to confirm a forthcoming lower low and trigger the resumption of the larger downtrend. On the other hand, a close above 1.1045 (R3) could signal the completion of a double bottom and perhaps set the stage for larger bullish extensions.
• Support: 1.0700 (S1), 1.0625 (S2), 1.0575 (S3).
• Resistance: 1.0860 (R1), 1.0965 (R2), 1.1045 (R3).
USD/JPY rebounds from 118.70
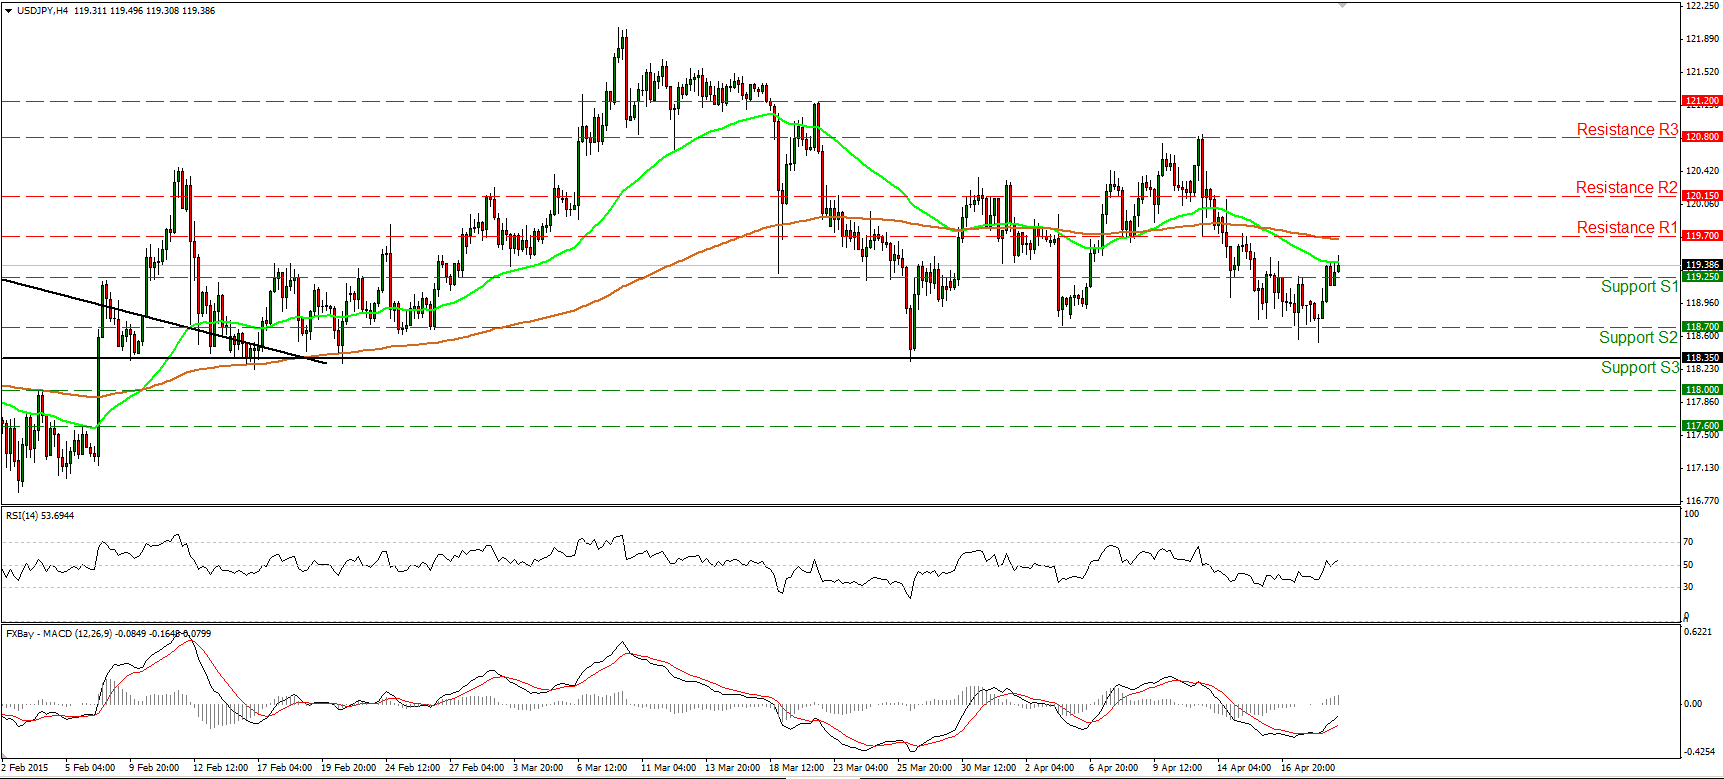
USD/JPY traded higher after triggering some buy orders slightly below the 118.70 (S2) support line. The rate has moved above the resistance (now turned into support) line of 119.25 (S1), something that could trigger extensions towards 119.70 (R1). A break above that resistance could pave the way for the 120.15 obstacle. Our short-term oscillators detect bullish momentum and amplify the case for the occurrence of the aforementioned scenario. The RSI raced higher and crossed above its 50 line, while the MACD moved above its trigger, points north and is headed towards its zero line. On the daily chart, the rate is trading below the 50-day moving average, but well above the 200-day one, also above the upper line of the triangle formation that had been containing the price action since November. This keeps the major uptrend intact, but given that there is still negative divergence between the daily oscillators and the price action, I would prefer to stand aside for now as far as the overall picture is concerned.
• Support: 119.25 (S1), 118.70 (S2), 118.35 (S3).
• Resistance: 119.70 (R1), 120.15 (R2), 120.80 (R3).
GBP/USD fails to sustain above 1.5000
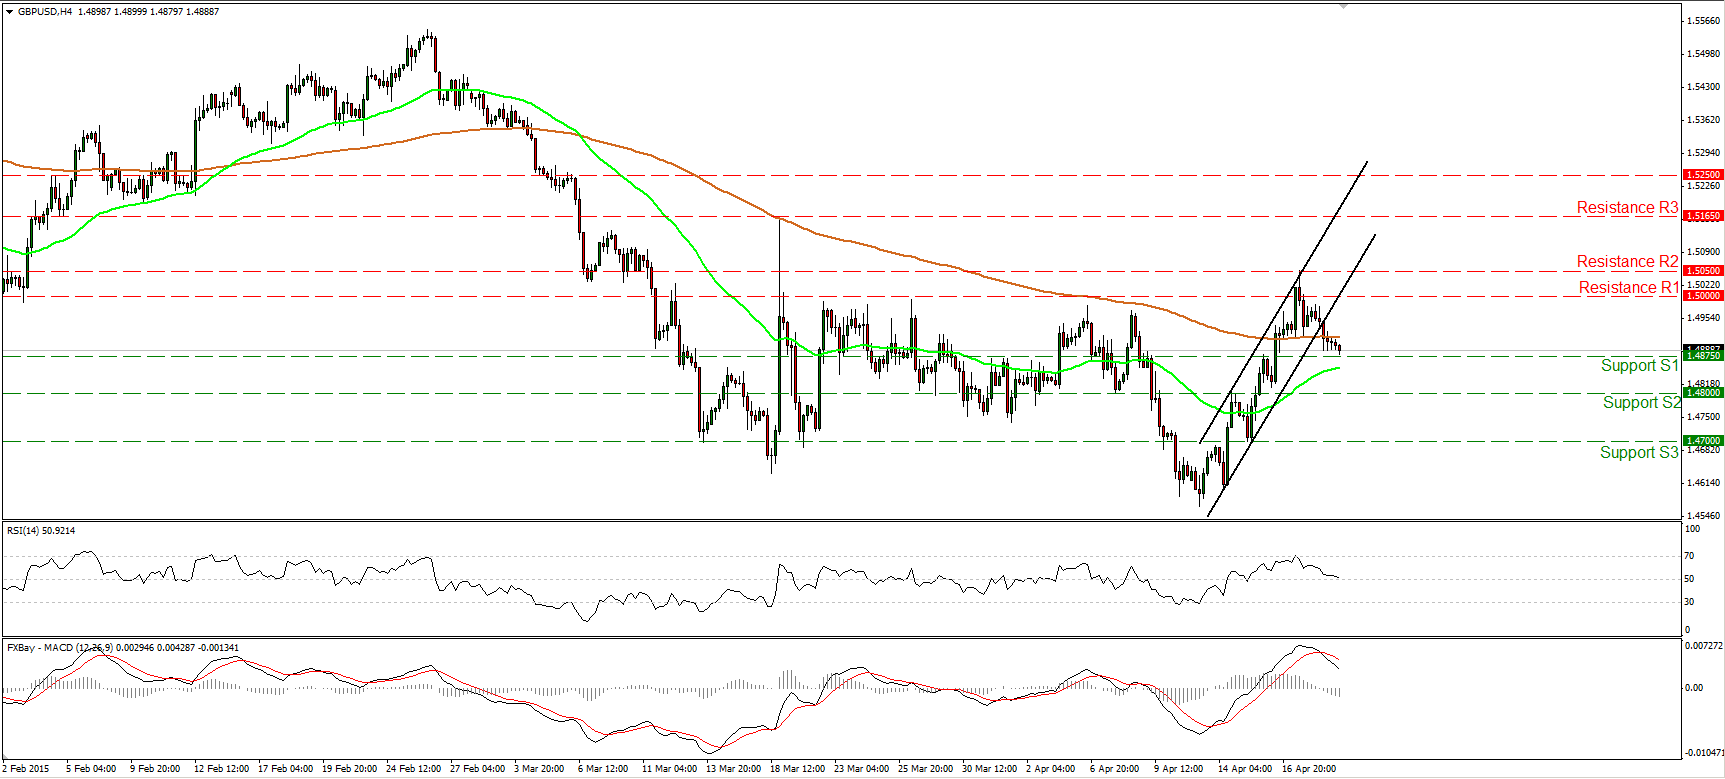
GBP/USD hit resistance near 1.5050 (R2) on Friday, but failed to maintain its upside strength and slid back below the psychological barrier of 1.5000 (R1). After that, I believe that we are likely to see the rate trade lower. During the early European morning Tuesday, Cable seems ready to challenge the 1.4875 (S1) support line, where a clear dip could set the stage for downside extensions towards the 1.4800 (S2) line. Our short-term oscillators support the notion. The RSI tumbled after hitting resistance at its 70 line, while the MACD has topped and fallen below its trigger line. Zooming out to the daily chart, I see that Cable is still trading below the 80-week exponential moving average, which keeps the large downtrend intact. However, there is positive divergence between our daily oscillators and the price action. I prefer to see momentum and price align before getting confident again on that large downward path.
• Support: 1.4875 (S1), 1.4800 (S2), 1.4700 (S3).
• Resistance: 1.5000 (R1), 1.5050 (R2), 1.5165 (R3).
Gold still trendless
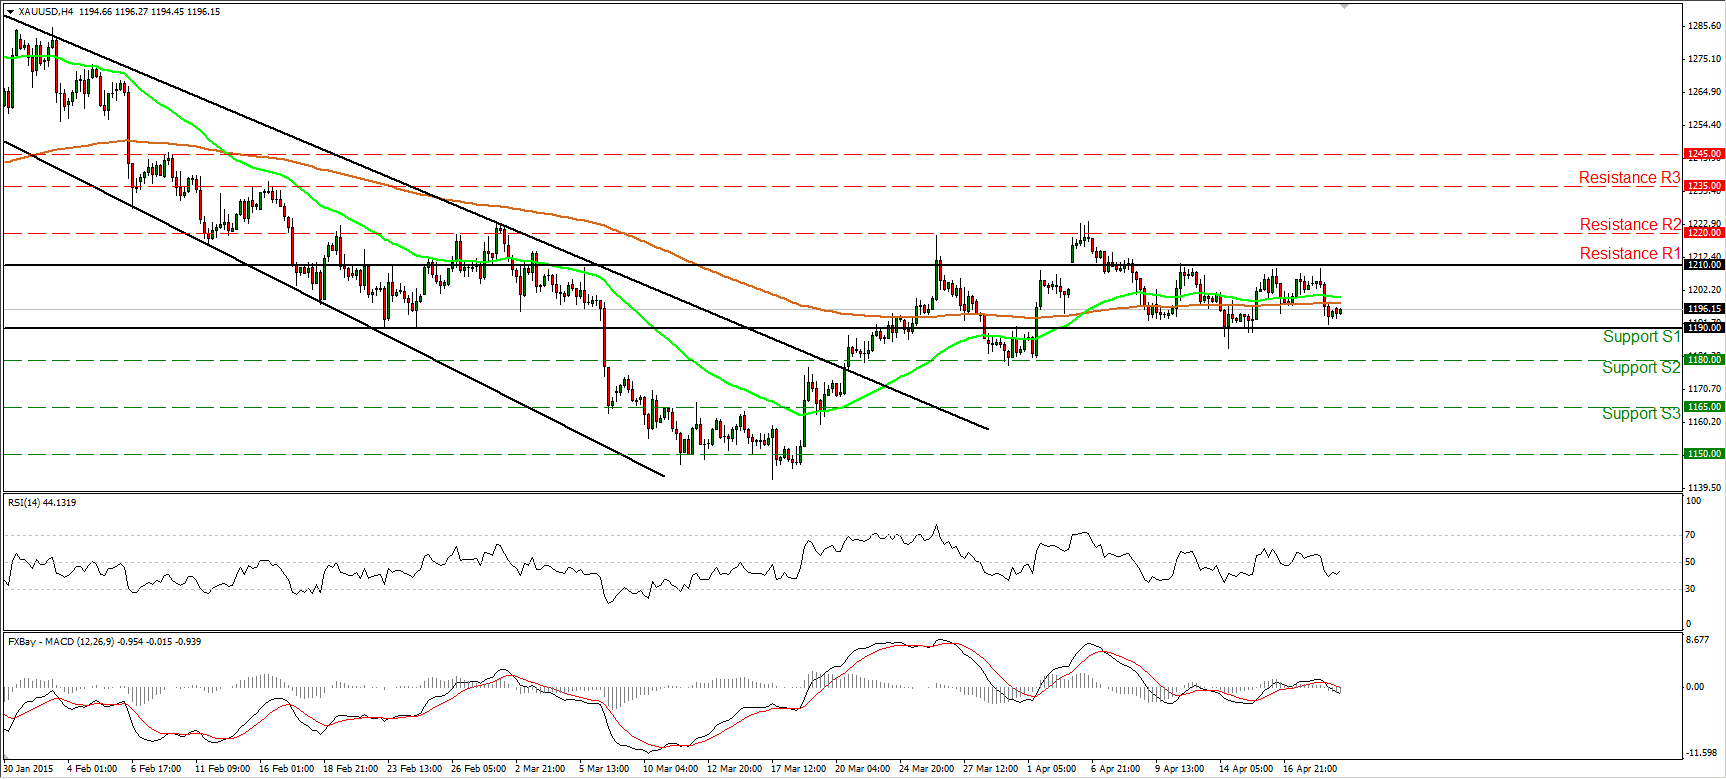
Gold traded lower on Monday and hit support marginally above the 1190 (S1) barrier. The precious metal is still trading between that support and the resistance of 1210 (R1). Therefore, I would consider the short-term picture to be neutral for now. The 50- and 200-period moving averages both point east, supporting the notion. Our daily oscillators do so as well. They both oscillate around their equilibrium lines. A move below 1190 (S1) is needed to shift the bias back to the downside and perhaps trigger extensions towards our next support at 1180 (S2). As for the bigger picture, the price is still trading below the 50% retracement level of the 22nd of January - 17th of March decline. This still makes me believe that the 17th of March – 06th of April recovery was just a corrective move. However, I would prefer to see a clear close below 1180 (S2) to get confident on the downside again.
• Support: 1190 (S1), 1180 (S2), 1165 (S3).
• Resistance: 1210 (R1), 1220 (R2), 1235 (R3).
WTI rebounds from 55.00
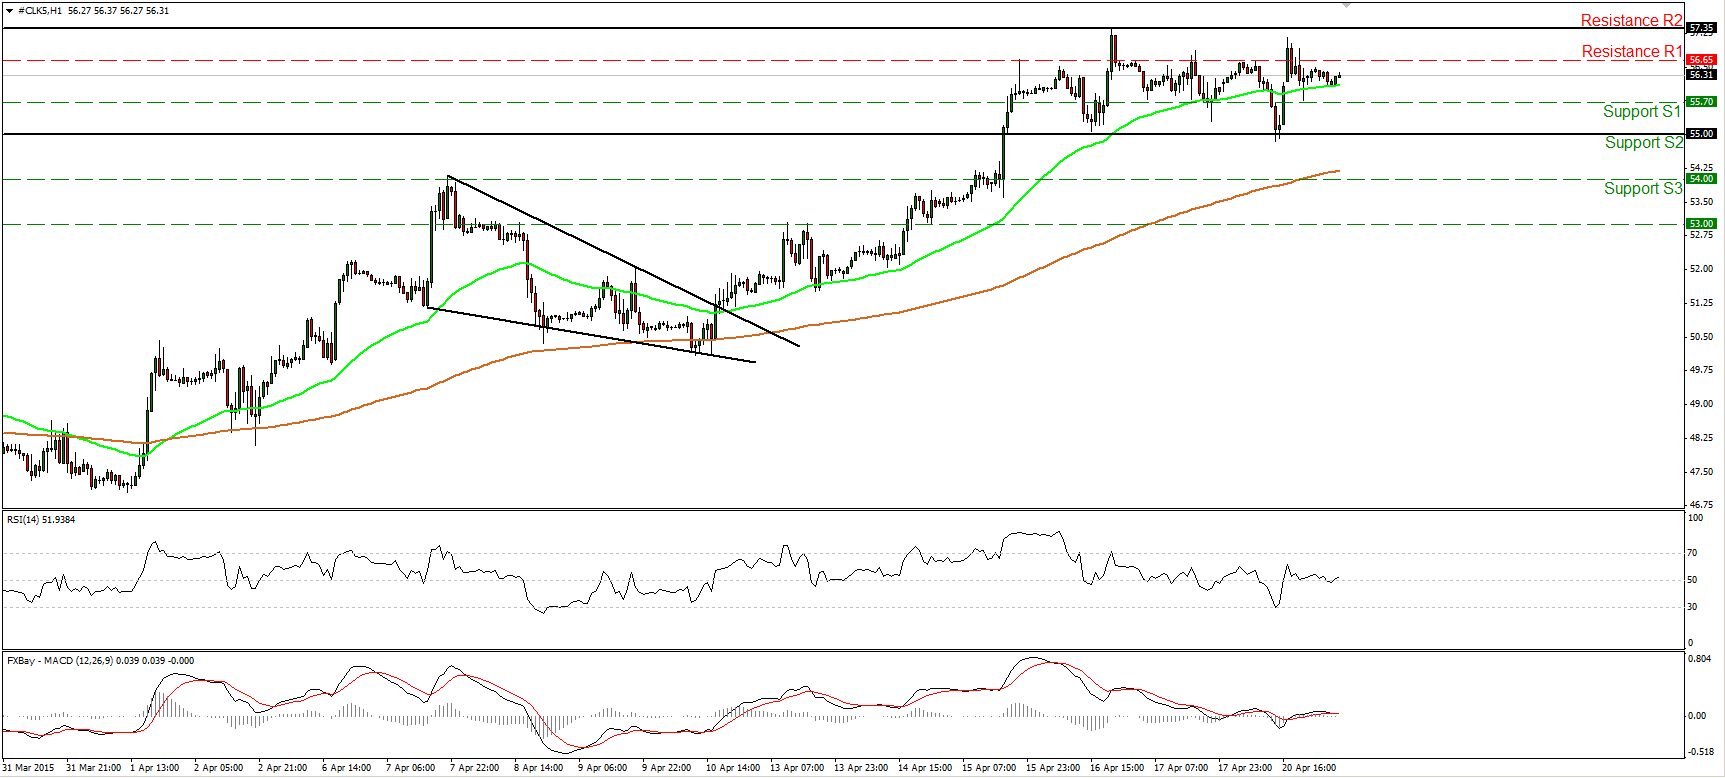
WTI traded lower yesterday, but after triggering some buy orders near the psychological line of 55.00 (S2), it rebounded to find resistance slightly below the 57.35 (R2) hurdle. WTI has been oscillating between those barriers since the 15th of April. Thus, I would switch my stance to flat as far as the short term is concerned. Nevertheless, for the broader trend, the break above 55.00 (S2) signalled the completion of a double bottom formation on the daily chart, something that could carry larger bullish implications in the not-too-distant future. A move above the upper bound of the short-term range, at 57.35 (R2), could challenge as a next resistance the 58.50 (R3) line, determined by the high of the 22nd of December.
• Support: 55.70 (S1), 55.00 (S2), 54.00 (S3).
• Resistance: 56.65 (R1) 57.35 (R2), 58.50 (R3).

