USD lower despite more hawkish Fed comments
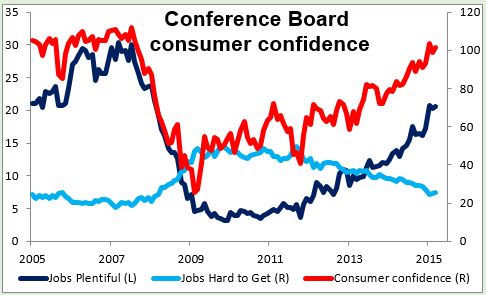
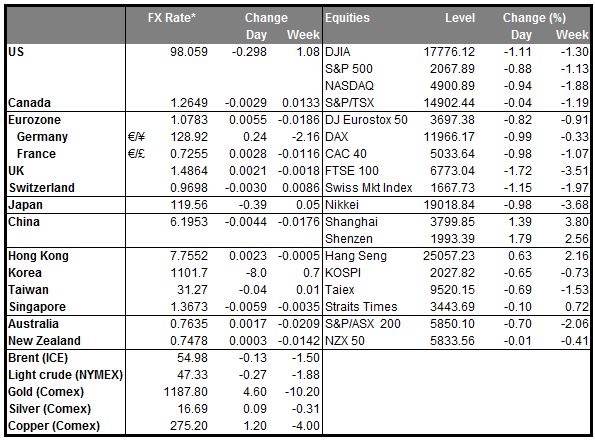
The dollar was largely lower against both the G10 and EM currencies despite more hawkish comments from Fed officials and slightly higher rate expectations. Richmond Fed President Lacker said the Fed should raise rates in June, while Kansas City Fed President George said “the sooner we do it, the better.” These comments are even more specific than Fed Chair Yellen’s recent statement that a rate rise was likely “sometime this year.” Although the Fed funds rate expectations moved up a bit with these comments, the generally weak economic data – a weak Chicago PMI and poor figure on the labor market in the Conference Board consumer confidence survey -- pushed Treasury yields lower and weakened the dollar. It’s hard to tell however whether the move was driven by the data or by the completion of the end-quarter buying that propelled the US currency higher on Monday. Today the market is likely to focus on the ADP report, which should help the dollar to recover its losses if it comes in as expected (see below).
China manufacturing PMI (just barely) back above 50 China’s official manufacturing PMI gained slightly in March to 50.1 from 49.9, beating expectations of a decline to 49.7 as it just barely poked its nose above the 50 boom-or-bust line. At the same time, the final HSBC/Markit PMI for the country was revised up slightly from the preliminary estimate, although it still remains in contractionary territory at 49.6. The figures may indicate some measure of success from the government’s stimulus measures, or perhaps just a rebound in activity after the Chinese New Year holiday. AUD rose sharply on the news but quickly lost all the gains. Nonetheless it remained slightly above yesterday morning’s level vs USD.
Perhaps more important than this monthly figure, China announced that it would insure bank deposits. This is a necessary step on the way to eliminating controls on interest rates and allowing more lenders to fail. While such steps will help to eliminate distortions in the economy and set growth on a more sustainable path in the long run, in the short run they mean more bankruptcies and economic turmoil as interest rates rise and companies surviving on negative real interest rates start having to earn a real return. This transition period towards a more balanced economic model is likely to be negative for AUD, in my view. (FYI iron ore for delivery in China fell further yesterday. It’s down almost 30% just this year. As for New Zealand, it remains to be seen what the impact of the end of EU quotas on milk production will be on the country’s exports to China. The long-standing quotas are being abolished as of today. It’s been reported that EU member states are planning production increases of as much as 20% to boost exports to Asia. This will compete directly with New Zealand. Milk and milk products accounted for 29% of its exports in 2014.
Tankan is disappointing Very disappointing Tankan! The Bank of Japan’s Q1 short-term survey of economic conditions was much weaker than expected. The index for the large manufacturers, the bellwether of the Japanese economy, was unchanged from Q4 and is expected to fall in Q2. Large non-manufacturers did slightly better as did small companies, but again their outlook is for a decline in Q2. A year after the hike in the consumption tax, confidence has yet to recover. Companies are now forecasting a cut in capital spending for the fiscal year, instead of a modest rise as expected. This may have something to do with the fact that they are assuming USD/JPY will average 111.81 in the new fiscal year that starts today. In any event, Japanese stocks fell on the news and USD/JPY moved down with them. The weekly correlation between Japanese stocks and USD/JPY recently hit the highest it’s been since at least 1980. This is somewhat counter-intuitive as a poor tankan figure like this suggests that the Bank of Japan may have to increase stimulus or try to weaken the yen further. I remain bullish on USD/JPY (i.e., bearish on the yen) as I expect the government will redouble its efforts to boost exports.
Today’s highlights: In Europe, we get the manufacturing PMI figures for March from several European countries, including the UK, and the final figure for the Eurozone as a whole. As usual, the final forecasts for the French, the German and Eurozone’s figures are the same as the initial estimates. The UK manufacturing PMI is estimated to slightly increase to 54.4 from 54.1.
In the US, the main event will be the ADP employment report for March two days ahead of the nonfarm payroll release. The ADP report is expected to show that the private sector gained more jobs in March than it did in the previous month. Although there is a lot of variation between the ADP and the NFP reports, if the ADP report comes strong, it would suggest that Friday’s nonfarm payroll figure may come in strong as well. This could add to USD strength. The final Markit manufacturing PMI and the ISM manufacturing index both for March are to be released.
From Canada, the RBC Manufacturing PMI for March is expected. The market doesn’t pay that much attention to it and prefers the Ivey manufacturing PMI instead.
As for the speakers, Atlanta Fed President Dennis Lockhart will chair a panel at the Atlanta Fed's financial markets conference with the topic, “Monetary Policy: Will the Traditional Banking Channel Remain Central to Monetary Policy?'' San Francisco Fed President John Williams will participate.
The Market
EUR/USD falls below 1.0800
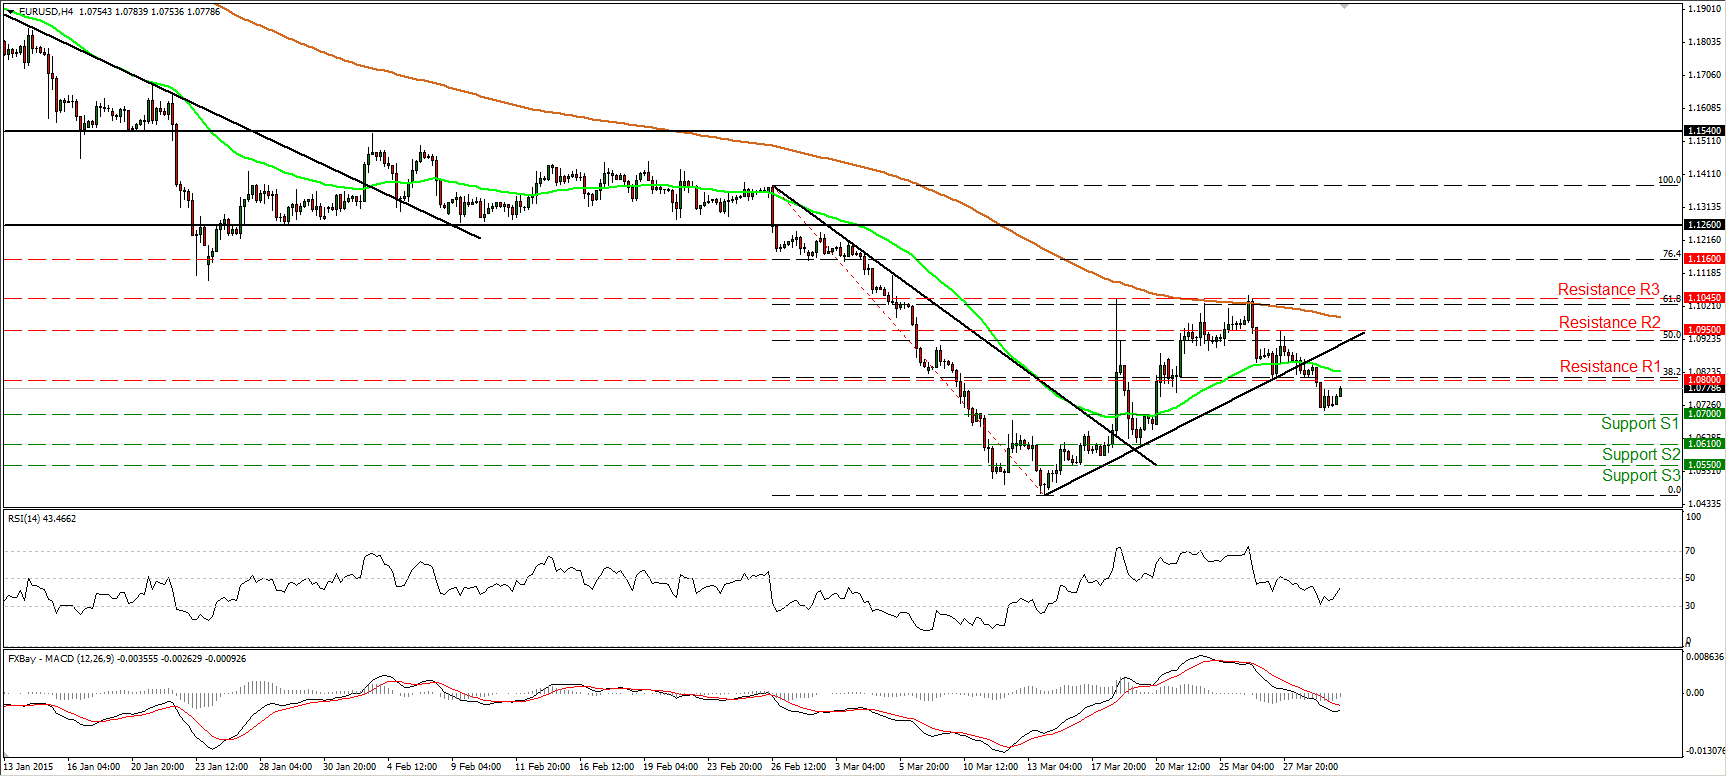
EUR/USD continued falling on Tuesday and managed to break below the support (now turned into resistance) of 1.0800 (R1). Nevertheless the decline was halted marginally above our next support line at 1.0700 (S1), and subsequently the pair rebounded. The rate stays below 1.0800 (R1) and this keeps the short-term bias negative in my view. Today, the US ADP report is expected to show that the private sector gained more jobs in March than February. This could encourage the bears to take advantage of the proximity to the 1.0800 (R1) barrier and pull the trigger for another leg down near 1.0700 (S1). As for the broader trend, I still see a longer-term downtrend. The pair is forming lower highs and lower lows below both the 50- and the 200- day moving averages. As a result, I would treat the recovery from 1.0460 as a corrective phase of the larger down path.
• Support: 1.0700 (S1), 1.0610 (S2), 1.0550 (S3).
• Resistance: 1.0800 (R1), 1.0950 (R2), 1.1045 (R3).
GBP/JPY trades within a possible flag
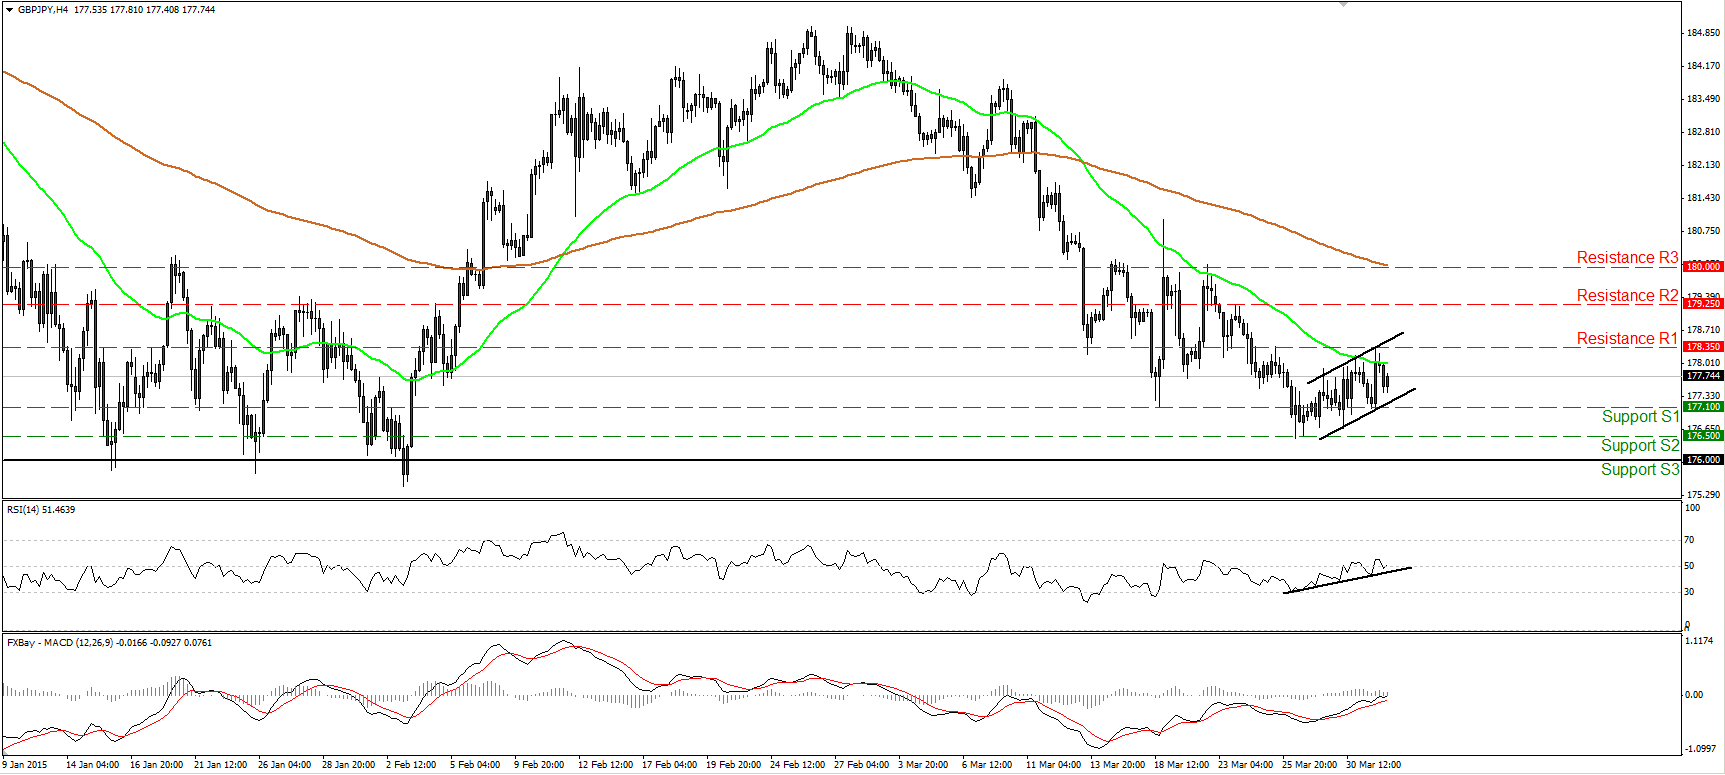
GBP/JPY appears to be trading within a possible rising flag formation. Despite the recent advance, and the rising momentum indicators, a rising flag is usually a bearish pattern. Therefore, I prefer to wait for the rate to break below the lower line of the pattern. A move below the 177.10 (S1) support will confirm the completion of the flag and bring trend resumption. In the case of such a break, I would expect the rate to accelerate lower and perhaps target the strong support zone of 176.00 (S3). As for the bigger picture, the rate is still trading below the 200-day moving average, while a decisive dip below 176.00 (S3) could complete a 5-month failure swing top and perhaps turn the overall outlook negative.
• Support: 177.10 (S1), 176.50 (S2), 176.00 (S3).
• Resistance: 178.35 (R1), 179.25 (R2), 180.00 (R3).
AUD/USD consolidates slightly above 0.7610
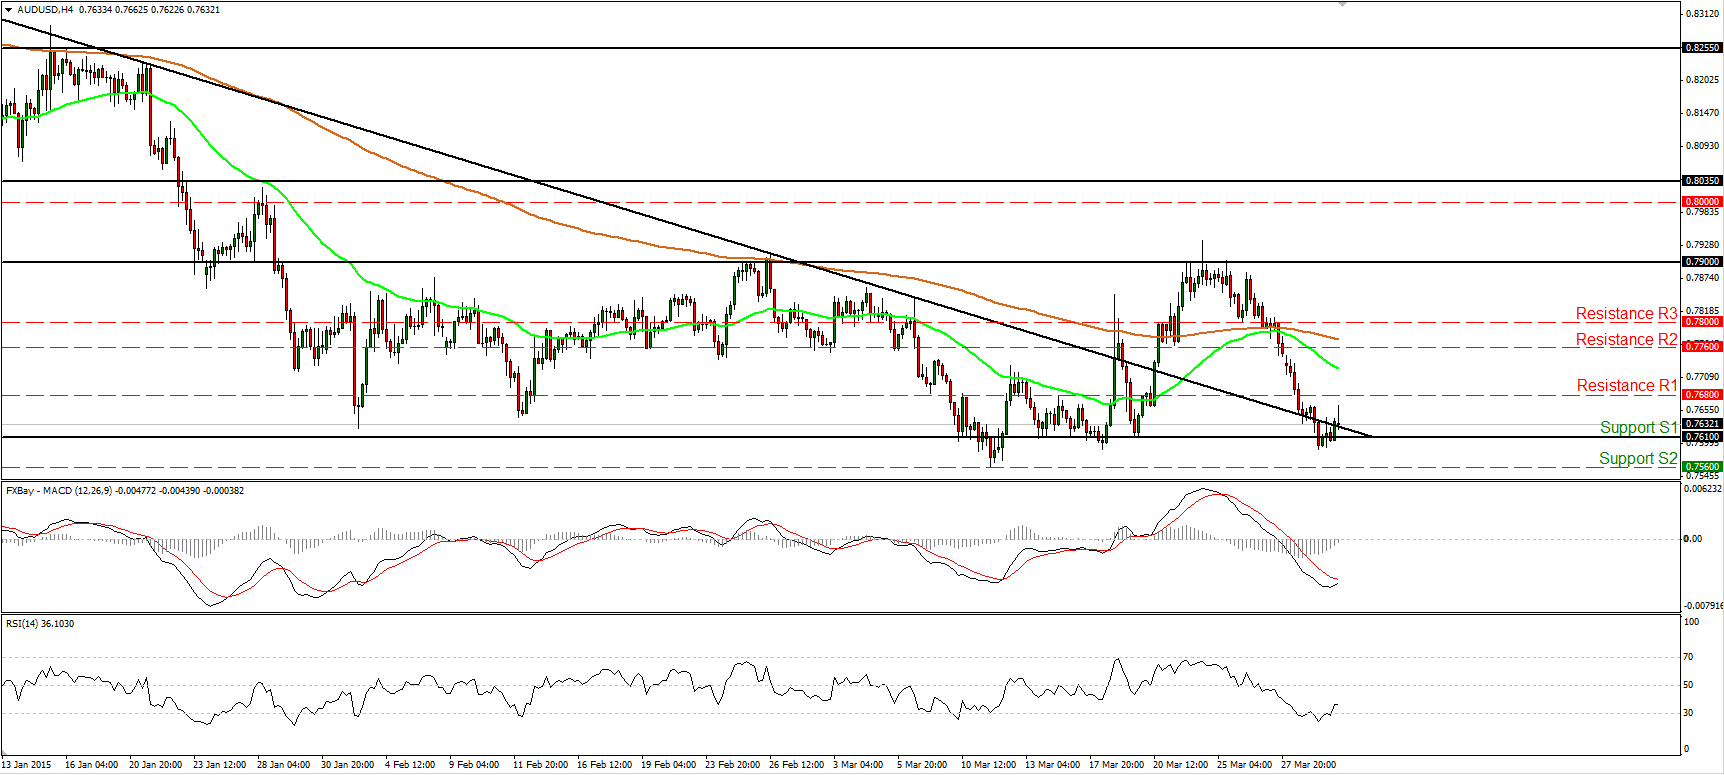
AUD/USD fell below the support (turned into resistance) barrier of 0.7680 (R1) on Monday, and on Tuesday it managed to reach the key support line of 0.7610 (S1). Based on our momentum signs, I would expect the forthcoming wave to be positive, perhaps to test the 0.7680 (R1) line as a resistance this time. The RSI edged higher after exiting its oversold territory, while the MACD shows signs of bottoming and could move above its trigger line any time soon. If the bulls are strong enough to drive AUD/USD above 0.7680 (R1), I would expect the possible rebound to extend towards 0.7760 (R2). Although, I believe we are likely to experience a short-term bounce, I maintain my neutral view as far as the overall outlook is concerned. First, the rate has been oscillating between 0.7610 (S1) and 0.7900 since the end of January. It traded slightly outside of that range for a very short amount of time. Second, AUD/USD is trading near the downtrend line taken from back the peak of the 5th of September, and third, there is still positive divergence between our daily momentum indicators and the price action.
• Support: 0.7610 (S1), 0.7560 (S2), 0.7500 (S3).
• Resistance: 0.7680 (R1), 0.7760 (R2), 0.7800 (R3).
Gold trades virtually unchanged
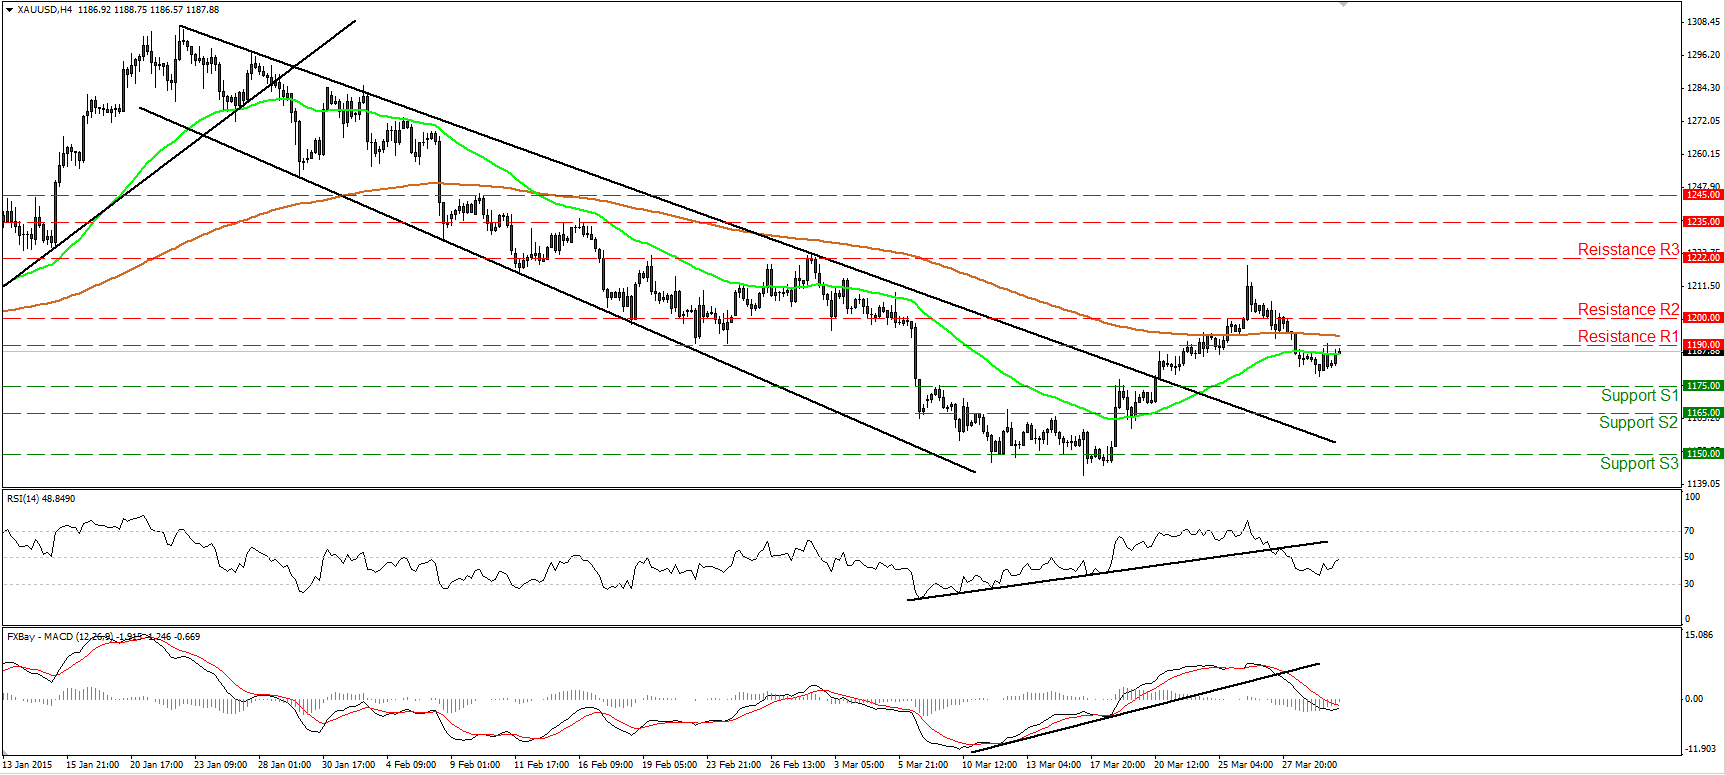
Gold continued sliding on Tuesday, but rebounded from above our support line of 1175 (S1) to trade virtually unchanged. As long as the possibility for a lower high exist, I would consider the short-term outlook to be cautiously negative. I believe that at some point, sellers will seize control and open the way for the 1175 (S1) line. A break below that line could bring more downside extensions perhaps towards 1165 (S2). Taking a look at our momentum studies though, I see a chance that the minor rebound may continue for a while before the bears prevail again. The RSI turned up and now looks ready to challenge its 50 line, while the MACD, although negative, shows signs of bottoming, and could move above its trigger soon. As far as the bigger picture is concerned, since the peak at 1307, the price structure has been lower highs and lower lows. The recent declines from near 1222 (R3) support the case that the 17th - 26th March recovery was just a corrective move that is probably over now.
• Support: 1175 (S1), 1165 (S2), 1150 (S3).
• Resistance: 1190 (R1), 1200 (R2), 1222 (R3).
WTI finds support slightly above 47.00
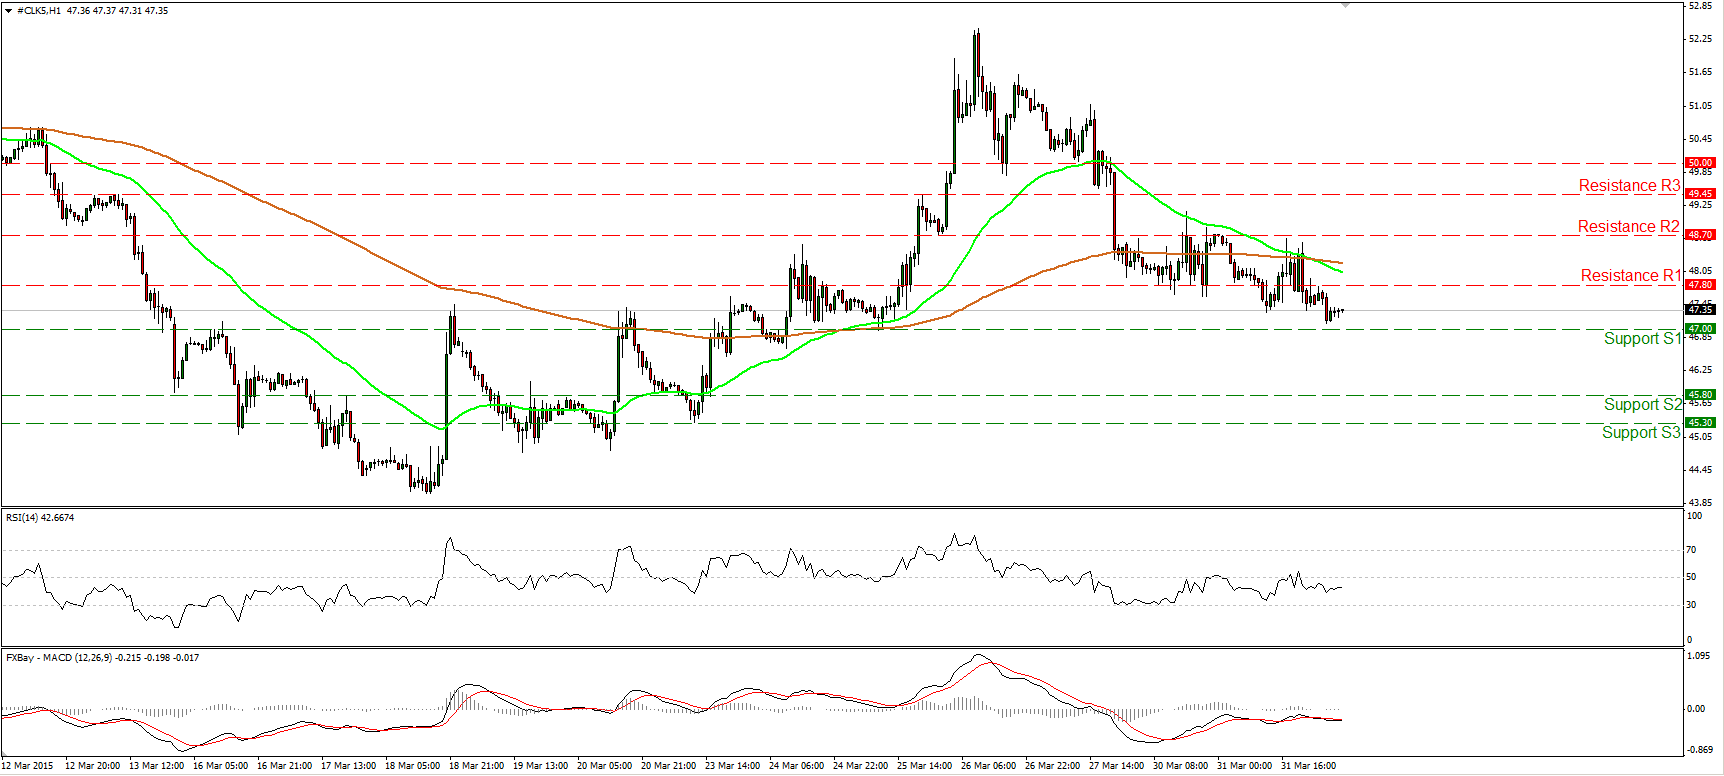
WTI slid yesterday but failed to touch the 47.00 (S1) barrier and found support slightly above it. However, I hold the view that the outlook on the 1-hour chart is negative, and I still expect a test at the aforementioned level. A clear break below that line could prompt extensions towards 45.80 (S2). Our hourly momentum studies corroborate my view. The 14-hour RSI lies below 50, while the hourly MACD stands below both its zero and signal lines. On the daily chart, WTI is trading well below the 200-day moving average and is now back below the 50-day one. This keeps the longer-term downtrend still intact. Nevertheless, there is still positive divergence between the daily oscillators and the price action. Therefore, I would prefer to wait for price and momentum alignment before getting confident again on the larger down path.
• Support: 47.00 (S1), 45.80 (S2), 45.30 (S3).
• Resistance: 47.80 (R1) 48.70 (R2), 49.45 (R3).

