More thoughts about the FOMC meeting
Yesterday I discussed the main question around Wednesday’s FOMC’s statement, namely whether they would drop the line about being “patient” about raising rates. According to the FT, my view is by now the consensus – most people think that they will indeed drop the line. The Fed wants policy to depend on the data, not on FOMC pronouncements, and so eliminating that forward guidance is the necessary first step.
Other topics to be discussed will be the new economic forecasts, including the famous “dot plot” of forecasts for the Fed funds rate. It’s likely that the members will upgrade their outlook for the labor market, which has improved since the last meeting, but they might also lower their forecasts for inflation, at least for this year. That would probably lead to lower forecasts for Fed funds, too. However the weighted average path of the “dot plot” is still so much higher than the market’s estimate of the likely course of rates that I don’t think it would make any difference to the FX market. If the actual pace of rate increases evolves anywhere near where the FOMC predicts, the market will be quite surprised and the dollar is likely to move significantly higher.

Assuming they do remove the word “patient,” the press conference will probably be taken up with explaining why the FOMC wants to begin the process of normalizing rates. I would expect to hear that there is no fixed date for the first hike and that it all depends on the incoming data. We will be looking for any clarity on what kind of data the FOMC would need to see in order to pull the trigger. In particular, the extremely bad weather and the dock strike in the US make it difficult to discern the underlying trend in output. How will they account for this?
DXY longs, AUD shorts hit record as speculators short almost everything Last Friday’s “Commitment of Traders” report showed two records for speculative positions: a record long DXY and a record short AUD. Such extended positions sometimes signal turning points in the market. While I certainly agree with the fundamental case here –- I’m also bullish on the dollar and bearish AUD -- the record positions suggest that there could be some short-covering at some point, leading to a (temporary) turnaround in the dollar. In a larger context, it’s also worrying that speculators are net short every currency covered in the COT report except RUB.

BoJ admits temporary defeat The Bank of Japan (BoJ), which had pledged to get inflation up to 2% by now, finished a Monetary Policy Committee meeting today with a statement admitting that CPI inflation “is likely to be about 0 percent for the time being, due to the effects of the decline in energy prices.” Nonetheless there were few other changes to its statement and in conclusion, the Board simply repeated that it “will continue with QQE, aiming to achieve the price stability target of 2 percent…” as long as necessary. Again, only one Board member dissented, meaning there is no rebellion building against the current program. Nonetheless, market-based estimates of inflation forecasts show that nobody believes they will hit their target. This makes me think (along with most other economists) that either the BoJ will have to increase its stimulus later in the year, or the government will have to try to push the yen lower again, or perhaps both. I remain bullish on USD/JPY.

The Reserve Bank of Australia (RBA) released the minutes of its March meeting, when it surprised the markets and left rates unchanged at 2.25% despite expectations for another 25bps cut. Nonetheless the minutes show that “members were of the view that a case to ease monetary policy further might emerge.” In other words, the market’s expectations were not wrong, just early as the RBA wants time to assess the impact of its previous cut before taking any new action. With the Chinese economy continuing to slow, I believe the RBA will have to ease policy further and I remain bearish on AUD as a result.
Today’s highlights: During the European day, the German ZEW survey for March is expected to show a rise in both indices. This would be the 5th consecutive rise in the indices, adding to the recent encouraging data from the country. Any EUR bounces however following the release are expected to be short-lived and the common currency is expected to continue its longer-term downtrend. Eurozone’s final CPI for February and the unemployment rate for Q4 are also coming out.

In the US, we get housing starts and building permits, both for February. The housing starts are expected to decrease, while the building permits are forecast to rise a bit. Even though the data are likely to show a mixed condition, the overall trend is consistent with an improving housing market. This could signal that the housing market supports what appears to be growing strength in the broader economy and keep the USD supported somewhat.
On Wednesday morning New Zealand time, the NZ current account deficit is expected to narrow. This could prove NZD-positive.
As for the speakers, German Chancellor Angela Merkel and ECB President Mario Draghi meet to discuss but no statement is planned to be released. ECB Executive board member Peter Praet also speaks.
The Market
EUR/USD trades higher

EUR/USD raced higher on Monday, confirming the positive divergence between our short-term oscillators and the price action. Bearing in mind that both the German ZEW indices for March are anticipated to have risen, I see the likelihood that the rebound may continue for a while, perhaps for another test near the 1.0665 (R1) resistance line. However, I still believe that the short-term picture is negative. I would expect any up moved to be short-lived and I would expect a move below 1.0460 (S1) to see scope for extensions towards the 1.0360 (S2) barrier, defined by the low of the 8th of January 2003. With regards to the broader trend, I believe that the pair is still in a downtrend. EUR/USD is printing lower peaks and lower troughs below both the 50- and the 200-day moving averages.
• Support: 1.0460 (S1), 1.0360 (S2), 1.0185 (S3).
• Resistance: 1.0665 (R1), 1.0800 (R2), 1.0900 (R3).
AUD/USD lower after RBA minutes

AUD/USD slid somewhat after the minutes of the latest RBA policy meeting showed what we already know, that further easing over the period ahead may be appropriate. The minor slide was stopped at 0.7610 (S1), where a dip is likely to aim for another test at the 0.7560 (S2) barrier, defined by the low of the 11th of March. Both our oscillators, although pointing sideways, remain within their negative territories, showing that the momentum is still negative. Switching to the daily chart, I see that the overall trend of the pair is still to the downside, and the recent low at 0.7560 (S2) confirmed my view that the 3rd – 26th of February advance was just a corrective move of the larger uptrend. I still believe that we are going to see AUD/USD challenging the 0.7500 (S3) territory in the future.
• Support: 0.7610 (S1), 0.7560 (S2), 0.7500 (S3).
• Resistance: 0.7680 (R1), 0.7750 (R2), 0.7840 (R3).
USD/JPY consolidated above 121.00

USD/JPY moved in a consolidative manner staying between the support line of 121.00 (S1) and the resistance hurdle of 121.60 (R1). The rate is also trading pretty close to the black uptrend line and the 50-period moving average. As a result I would expect the forthcoming directional move to be positive, perhaps for another test at the 122.00 (R2) territory, the high of the 10th of March. Our momentum studies support the notion. The RSI hit support at its 50 line and rebounded somewhat, while the MACD, already positive, shows signs of bottoming and could move above its signal soon. As for the broader trend, the rate is still trading above both the 50- and the 200-day moving averages, and above the upper bound of the triangle that had been containing the price action since November. This keeps the overall picture of USD/JPY positive.
• Support: 121.00 (S1), 120.55 (S2), 120.00 (S3).
• Resistance: 121.60 (R1), 122.00 (R2), 122.50 (R3).
Gold still trades in a consolidative mode

Gold hit resistance near our 1165 (R1) barrier and declined to hit once again the support line of 1150 (S1). The precious metal continues to trade in a sideways manner between these two hurdles, but taking into account that it is still trading below both the 50- and the 200-period moving averages, and below the downtrend line taken from back at the high of the 22nd of January, I still consider the outlook to be negative. I would expect a break below 1150 (S1) to have more bearish extensions and perhaps trigger extensions towards the 1140 (S2) zone. However, the RSI continues higher, while the MACD remains above its trigger and points north. Therefore, I would stay cautious that another minor bounce could be looming before sellers take the reins again.
• Support: 1150 (S1), 1140 (S2), 1130 (S3).
• Resistance: 1165 (R1), 1175 (R2), 1190 (R3).
WTI trades below January’s low for a while
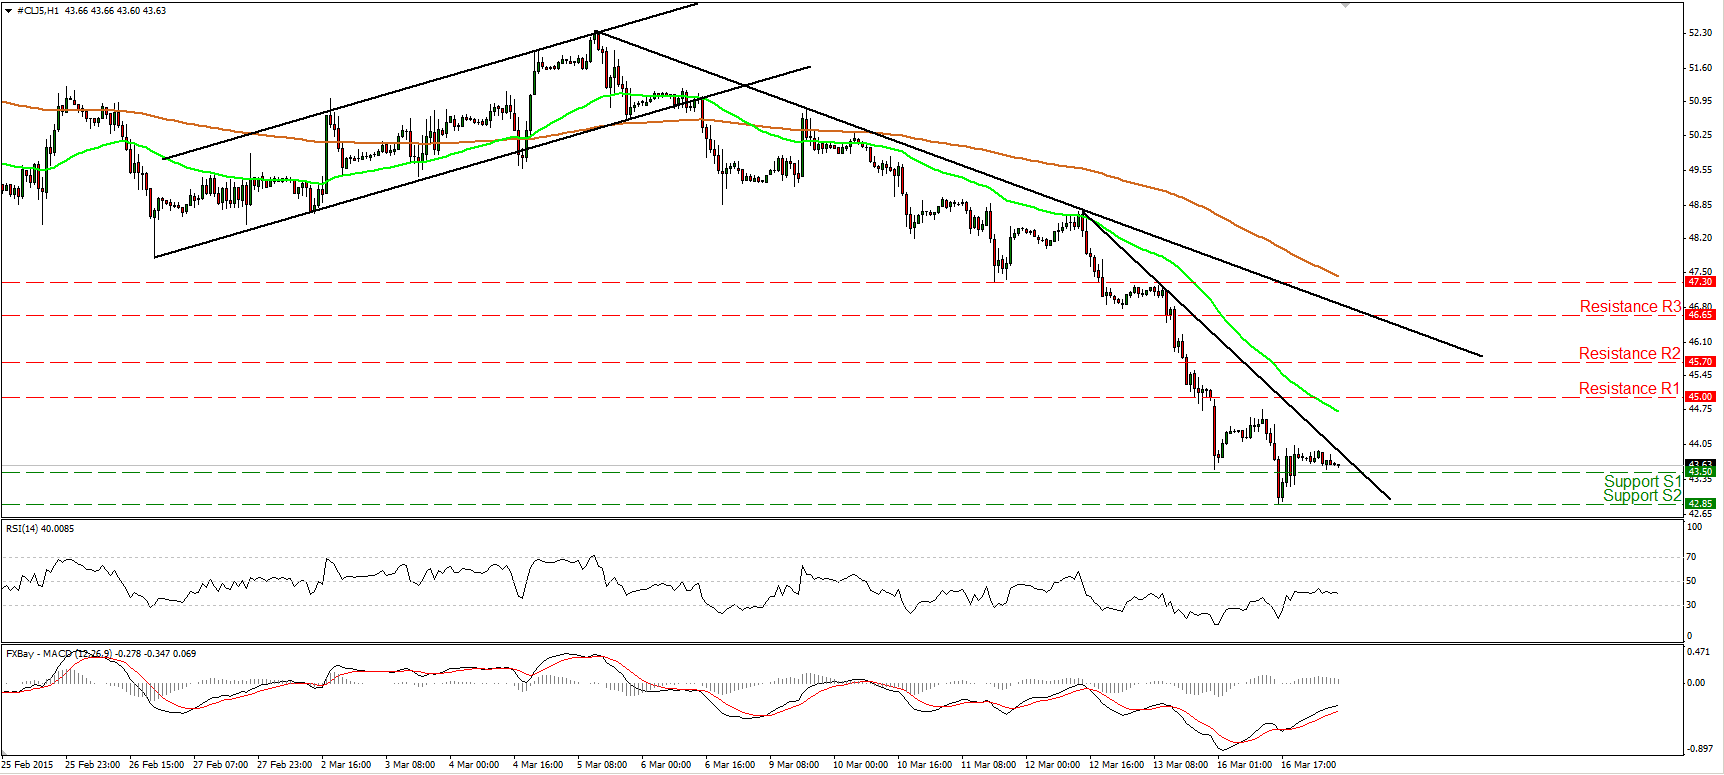
WTI tumbled and managed to break below the key support hurdle of 43.50 (S1), defined by the low of the 29th of January. However, the bears held the price below that barrier only for a couple of hours, as it triggered some buy orders at 42.85 (S2) and rebounded to trade above 43.50 (S1). In any case, given that the price is trading below the downtrend line taken from the peak of the 5th of March, I still see a negative short-term outlook. I would expect another test near the 42.85 (S2) line, and eventually a dip towards the 42.00 (S3) area, marked by the low of the 11th of March 2009. On the daily chart, WTI is still trading below both the 50- and the 200-day moving averages. Meanwhile, the 14-day RSI reached its 30 line and appears ready to move below it, while the MACD stays below both its zero and signal lines. This keeps the longer-term bias to the downside, in my opinion.
• Support: 43.50 (S1), 42.85 (S2), 42.00 (S3).
• Resistance: 45.00 (R1) 45.70 (R2), 46.65 (R3).
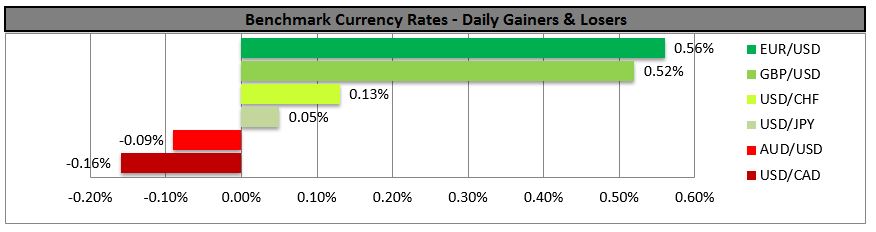
BENCHMARK CURRENCY RATES - DAILY GAINERS AND LOSERS
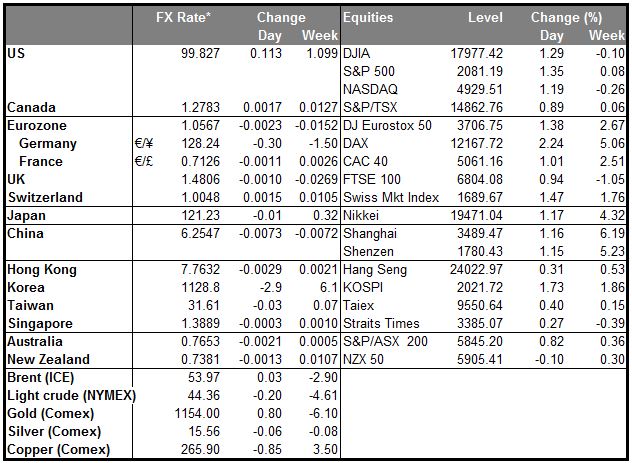
MARKETS SUMMARY