The market must be expecting an imminent rebound in the price of iron ore.
Almost two weeks ago, I proposed a pairs trade going short Rio Tinto (NYSE:RIO) versus long BHP Billiton (NYSE:BHP) as a way to play the top in the price of iron ore predicted by the Reserve Bank of Australia (RBA). Since then, iron ore has fallen from around $68 to $63 for a 7% loss. Yet, RIO is only down 3%. BHP is down more meaningfully with a 4% loss.
RIO is clinging to support at its 50-day moving average (DMA) while BHP broke down below its 50DMA support. (For comparison, Vale SA (NYSE:VALE) is down 7% and Cliffs Natural Resources (NYSE:CLF) is down 25 over this time). Perhaps the “reluctance” of the decline comes from an expectation of an imminent bottom in the price of iron ore. The chart of iron ore shows that the current price hovers above a brief trough from July and a multi-year low is not too much further away.
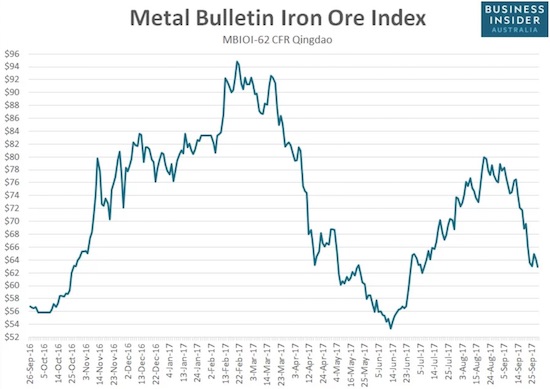
The price of iron ore continued a plunge that began with August’s topping process.
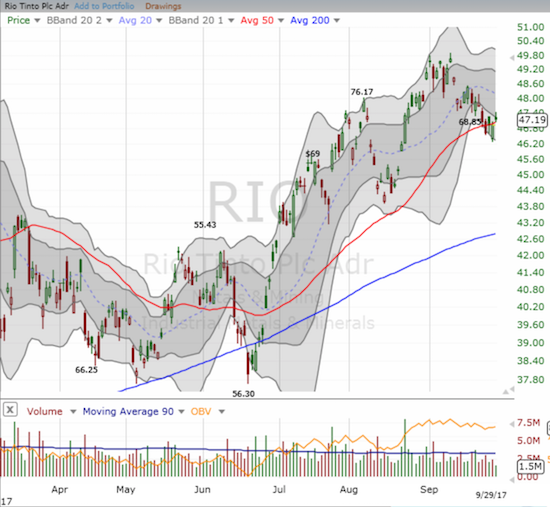
Rio Tinto (RIO) has managed to remain somewhat resilient. Its 50DMA still holds as support.
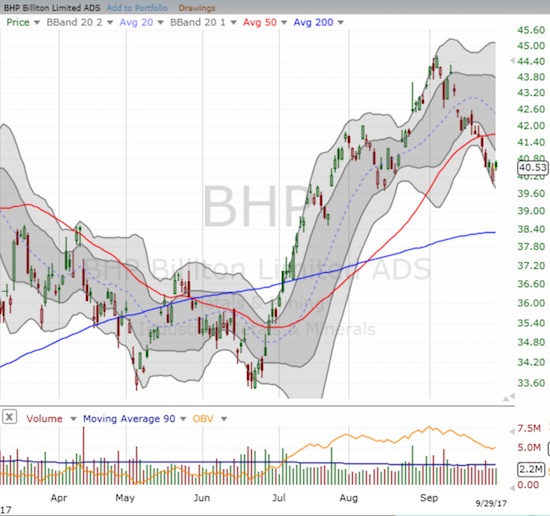
BHP Billiton looks weaker than RIO: a clean 50DMA breakdown that affirms the September top.
The distinct differential in performance suggests that I should have flipped around the configuration of my pairs trade. However, RIO made a strong move in its favor shortly after I wrote about the trade. On September 21st, RIO announced a massive $2.1B boost to its share buyback. That money adds yet more cushion to an already large buyback and a healthy dividend payout.
While my options positions do not expire until January, 2018, I am now wondering whether they will die on the vine with both RIO and BHP soon settling into a trading range.
Speculators in the Australian dollar (Guggenheim CurrencyShares Australian Dollar (NYSE:FXA)) are also not concerned with the plunge in the price of iron ore. They continue to accumulate net long positions which now sit at a 4 1/2 year high.
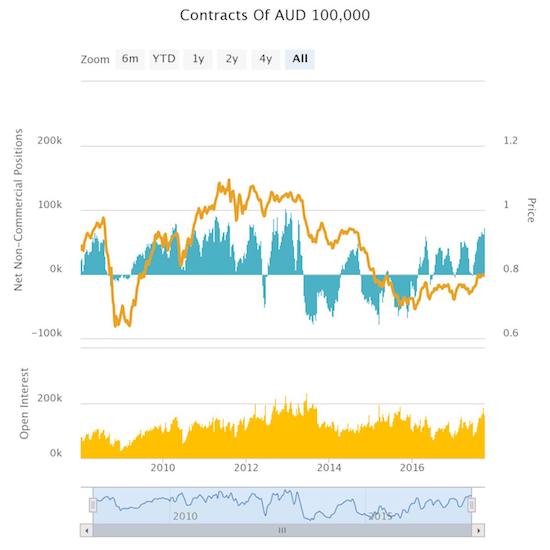
Speculators have not been this bullish on the Australian dollar (FXA) in over 4 years.
This continued accumulation comes as the Australian dollar is finally weakening against major currencies. AUD/USD in particular is cracking its low from August in a move that is confirming the earlier 50MDA breakdown which in turn seals the deal on a top for now.
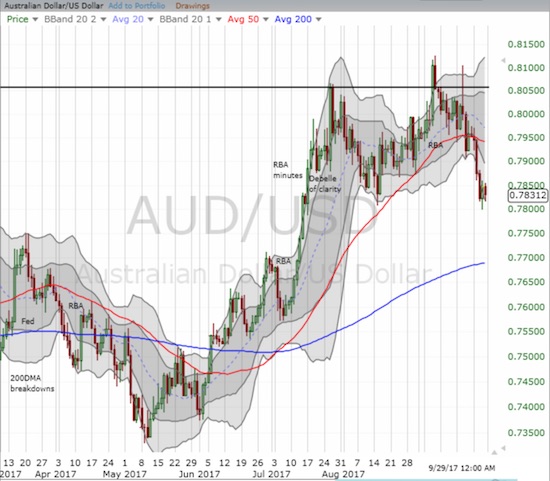
The Australian dollar is breaking down against the U.S. dollar. AUD/USD looks like it is topping.
The mix of signals motivated me to back down from taking sides in the bear/bull battle on the currency. I now trade even more opportunistically than usual.
Be careful out there!
Full disclosure: net long the Australian dollar, long RIO puts, long BHP calls, long CLF calls
