It has been a very busy week across the different commodity sectors with the escalating tensions and violence in Iraq by far being the most important driver both for energy and precious metals.
However the DJ-UBS commodity index only managed to rise by 0.8 percent as strong gains in those two sectors were offset by losses in industrial metals which derived from worries about the economic impact of rising oil prices and an ongoing investigation into double counting of copper inventories in China. The agriculture sector were also weaker, not least grains where a 2014/15 season with plenty supplies are looming 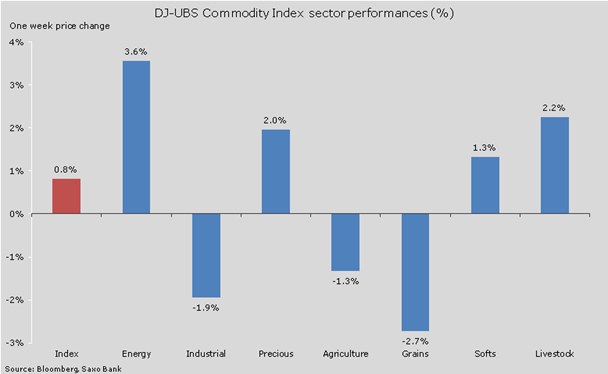
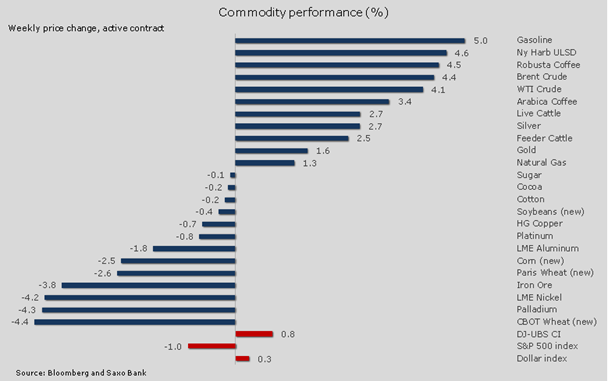
The DJ UBS Energy index has risen by 3.6 percent over the past week thereby reaching the highest level since December 9. All of the four major energy contracts sitting at the top of the performance table this week and the strong gains has resulted in the price of both WTI Crude and gasoline reaching the seasonally-highest level for this time of year in six years. Furthermore, the spike is coming just at a time where seasonal demand for crude and gasoline is picking up ahead of the US motoring season and increased demand from utilities as cooling demand rises, not least in some of the major oil producing countries, such as Saudi Arabia, where the direct burn of cheap fuel is favoured over gas.
The escalating violence in Iraq could potentially threaten supplies from OPEC’s second-largest producer if it spreads to the south of the country. This is happening at a critical time for OPEC as it is already struggling to meet its production target of 30 million barrels per day. Not least considering Libya where production is down by 90 percent from the peak and Iran which could see its sanctions increase after July following a failure to reach an agreement with the West over its nuclear intentions. Iraq has been one of the positive stories in terms of increased production and from a current level of 3.3 million barrels per day the government had set itself a very ambitious target of four million barrels by the end of the year, increasing further to 7 million by 2016. However, the current fighting will make it close to impossible to develop untapped resources in the northern and eastern parts of the country. The key question over the coming days and weeks is whether Baghdad, Karbala and the Shiite controlled oil producing fields and export facilities in the south can remain calm and avoid becoming embroiled in the conflict. 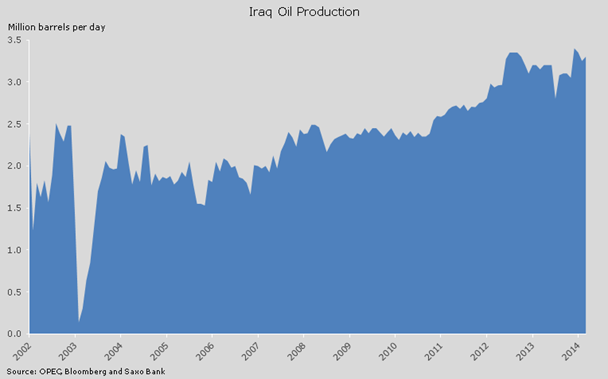
The below chart shows the price impact of previous geopolitical events since 2011 when the Arab Spring led to the Libyan civil war. During this time, the price of Brent crude has been averaging 110 USD/barrel and the spikes are measured as the percentage move away from the average. The current rally is small relative to what we have previously seen but given Iraq's importance and the seasonal pick-up in demand sellers will be outnumbered by buyers until we have a clearer picture of developments there. It would require a price reversal back below 105 USD/barrel on WTI crude and 111 USD/barrel on Brent crude in order to create any second thoughts from those speculating on higher prices. 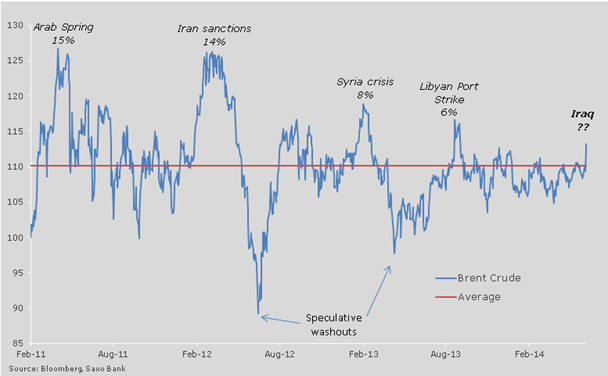
Precious metals received a small boost from this increased geopolitical threat and both gold and silver managed the first back-to-back week of gains since April. Silver is the strongest performer on the week and it is now threatening to break higher through the downtrend from the April 2011 peak at 50 USD/oz.
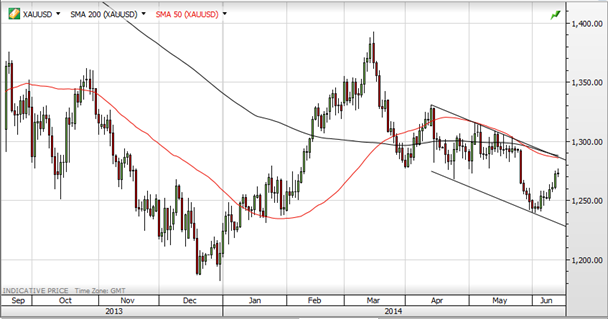
Adding to the safe-haven buying the market could also begin to speculate that the current rise in the cost of energy could hurt demand and stall the still fragile global economic recovery, just like we saw during the two previous price spikes in 2011 and 2012. Furthermore, gold received a bid from news that the mining strike in South Africa, which has crippled production of platinum and palladium since January, may soon come to an end. Platinum and especially palladium sold off heavily on this news resulting in long ratio trades against gold being closed. Gold is looking to consolidate its gains and only a break back above trend line and 200-day moving average resistance at 1288 will signal a return back above 1300. Silver is trading at its strongest level relative to gold in two months and would look interesting on a break above 20 USD/barrel.
