
Forex News and Events
Tsipras resigns and stock markets fall sharply
Yesterday, against all odds and after a nine-month mandate which has seen an agreement on a €86bn bailout, Tsipras resigned. He then called for new elections. Earlier reports suggest that these will likely take place around the 20th of September.
Tsipras negotiated strongly with Greece’s creditors but against all odds and after a referendum where the “No” vote won, he decided to comply with the creditors. Furthermore the agreed plan was even worse to the one that was decided before the referendum. Ironically, despite the “No” vote won, Greek think that the Eurozone can only be a chance for their future. Following this logic, massive austerity measures should also be seen as a great opportunity.
Yesterday, global stock markets reacted sharply as most markets ended up very negative. We still remain suspicious on the so called austerity measures as we think that most European countries will not be able to reimburse their debt. In addition the situation in the U.S. is concerning as we consider that mixed data do not support a September rate hike. Last but not least, Chinese stock markets follow its decline. The bottom line is that we wonder on what extent central banks are able to regulate efficiently the economy.
As we expected (see previous newsletters), the EUR/USD resistance at 1.1278 has been broken on the Greek bailout settlement. Now, the key driver will be any announcement by Janet Yellen or other Fed members. At some point we judge that a Fed statement saying that no September rate hike will happen as likely. The surge of euro is not over yet.
Investors in risk-off mode
Global risk sentiment remains under significant selling pressure. Most major equity indices are trading below their 200d MA while the VIX has spiked to 19.4. USD has had mixed performance (2yr-yields falling to 0.64%), weaker against non-commodity G10 currencies yet stronger against commodity and EM currencies. Gold has returned as a safe-haven of choice rallying $40 to $1168 this week. The well over bought USD positioning has distorted the move slightly. The last five years of bullish asset pricing have been predicated on three key issues (not solely global loose monetary policy). US monetary policy, growth in China and stability of the EU. When all three are positive (plenty of US monetary stimulus, solid growth data in China and when Greece and Brussels are in relative harmony), global risk appetite surges. Yet when the three are not in-synch, investors’ risk-taking behavior suffers. While each driver affects segments differently, in whole high correlations levels cultivates the customary risk-on & off pattern. We are in a current environment where all three drivers have turned negative for risk seekers. From the US, incoming economic data and matching Fed speak (via minutes and comments) until recently supported a rate hike in 2015. While, China’s deceleration in growth, including today's Caixin flash manufacturing PMI falling to 47.1 to its lowest level since March 2009, indicates Chinese economic slowdown is deeper than anticipated. The final nail arose with news that Greek Prime Minister Alexis Tsipras resigned, triggering renewed political uncertainty in Europe. Interestingly, this development came right after Greece made an €3.2bn debt repayment to the ECB and central banks of EZ nations, satisfy Athens obligations toward these critical creditors for the next 11 months. The lack of repayment pressure will give whatever new government is fashioned (either through a snap election or opposition forming a new government) additional room to negotiate with creditors. Therefore conceivably taking investors on another typical Greek crisis roller coaster ride. After an unprecedented six year bull run the downside in equity prices is worryingly distant. In our view, it will take a reversal in markets perception of one of these drivers to halt the current selling pressure and convince investors to become risk seekers again.
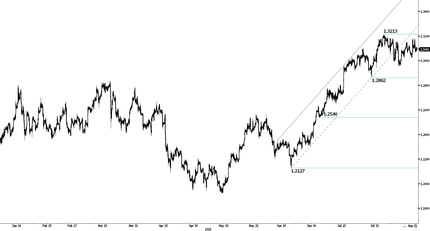 USD/CAD - Still Trading In Range" title="USD/CAD - Still Trading In Range" height="231" width="430">
Today's Key IssuesCountry / GMT Jul Public Finances (PSNCR), last 13.9B GBP / 08:30 Jul Central Government NCR, last 17.7B GBP / 08:30 Jul Public Sector Net Borrowing, exp -2.8B, last 8.6B GBP / 08:30 Jul PSNB ex Banking Groups, exp -1.1B, last 9.4B GBP / 08:30 Bloomberg Aug. Sweden Economic Survey SEK / 09:00 Bloomberg Aug. Norway Economic Survey NOK / 09:05 Bloomberg Aug. Denmark Economic Survey DKK / 09:10 Aug IBGE Inflation IPCA-15 MoM, exp 0.43%, last 0.59% BRL / 12:00 Aug IBGE Inflation IPCA-15 YoY, exp 9.57%, last 9.25% BRL / 12:00 Jun Retail Sales MoM, exp 0.20%, last 1.00% CAD / 12:30 Jun Retail Sales Ex Auto MoM, exp 0.50%, last 0.90% CAD / 12:30 Jul CPI NSA MoM, exp 0.10%, last 0.20% CAD / 12:30 Jul CPI YoY, exp 1.30%, last 1.00% CAD / 12:30 Jul Consumer Price Index, exp 127.5, last 127.2 CAD / 12:30 Jul CPI Core MoM, exp 0.00%, last 0.00% CAD / 12:30 Jul CPI Core YoY, exp 2.40%, last 2.30% CAD / 12:30 Jul CPI SA MoM, last 0.40% CAD / 12:30 Jul CPI Core SA MoM, last 0.30% CAD / 12:30 Aug P Markit US Manufacturing PMI, exp 53.8, last 53.8 USD / 13:45 Aug A Consumer Confidence, exp -6.9, last -7.1 EUR / 14:00 Jul Formal Job Creation Total, exp -115800, last -111199 BRL / 18:00 SURVEY: Private Capital Expenditure 2015-16 A$111 Bln AUD / 22:00
The Risk Today
EUR/USD has broken the resistance at 1.1278 (29/06/2015). Over the last month, the pair is setting higher highs. There is a short-term upside momentum. Hourly resistance lies at 1.1436 (18/06/2015 high). Support can be found at 1.0660 (21/04/2015 low). In the longer term, the symmetrical triangle from 2010-2014 favors further weakness towards parity. As a result, we view the recent sideways moves as a pause in an underlying declining trend. Key supports can be found at 1.0504 (21/03/2003 low) and 1.0000 (psychological support). Break to the upside would suggest a test of resistance at 1.1534 (03/02/2015 reaction high).
GBP/USD has shifted into a consolidation pattern after slight bullish recovery. However, drift lower indicates persistent selling pressure. Stronger support is given at the 38.2% Fibonacci retracement at 1.5409. Hourly resistance is given at 1.5733 (01/07/2015 high). The short-term structure shows an upside momentum. In the longer term, the technical structure looks like a recovery bottom whose maximum upside potential is given by the strong resistance at 1.6189 (Fibo 61% entrancement).
USD/JPY is still declining. However we consider that this is not sufficient to enter into a declining momentum. The road is still wide open towards the stronger resistance at 125.86 (05/06/2015 high). Hourly support is given by the 38.2% Fibonacci retracement at 122.04. A long-term bullish bias is favored as long as the strong support at 115.57 (16/12/2014 low) holds. A gradual rise towards the major resistance at 135.15 (01/02/2002 high) is favored. A key support can be found at 118.18 (16/02/2015 low).
USD/CHF is moving lower, suggesting persistent selling pressures. The pair has broken the 38.2% Fibonacci retracement. We are now into a short-term declining trend-line. In the long-term, the pair has broken resistance at 0.9448 suggesting the end of the downtrend. This reinstates the bullish trend. Key support can be found 0.8986 (30/01/2015 low).
