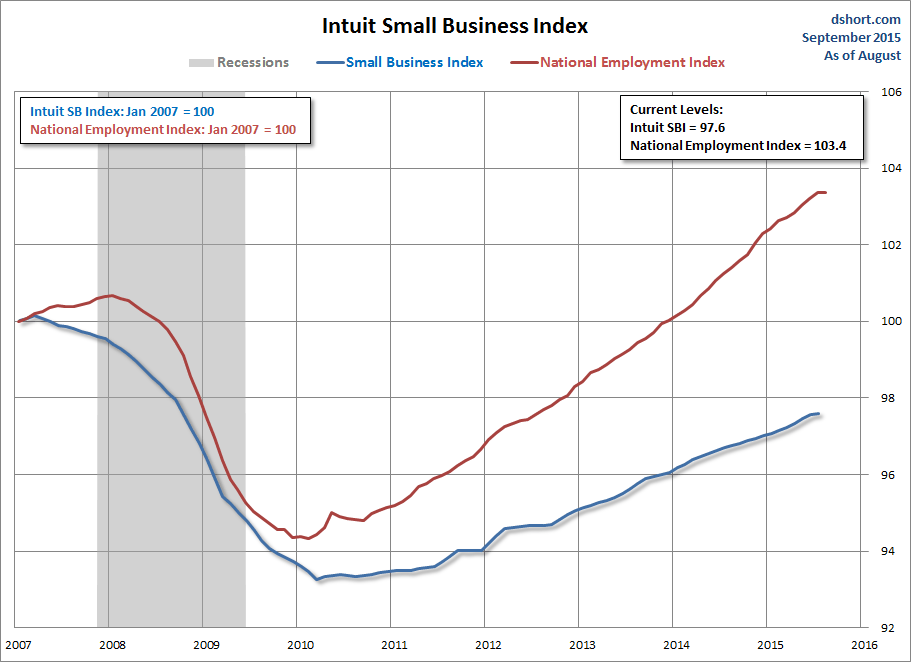
Here we introduce the Intuit Small Business Employment Index (SBI) which measures employment in firms with fewer than 20 employees with data going back to 2007. The real-time data comes directly from Intuit (NASDAQ:INTU) software, not from surveys, and is the only source of monthly data on small business revenues, expenses, and payroll data. It allows for a much earlier read on the health of small businesses.
Here is an excerpt from Intuit’s overview of the index:
The goal of the Intuit Small Business Employment index is to provide a forecast of the current level of employment for firms with fewer than 20 employees that BLS will report when it next releases the BED data. To construct this forecast, we use a combination of data from Intuit's small business payroll service customers, data from BLS on payroll employment (from the establishment survey) and self-employment (from the household survey). The forecast model measures the relationship between past BLS levels of employment for small firms to total payroll employment, private payroll employment, construction payroll employment, self-employment, plus an index of employment built from data from Intuit Online Payroll customers.
These small businesses (less than 20 employees) make up 87 percent of the total U.S. private employer base, which is almost 21 million people. The SBI represents 5 percent of this nationwide category.
Intuit has created an index based on the monthly employment numbers from BLS with 100 equaling January 2007. We have used that series for our charts with recessions highlighted. The current index comes in at 97.6.

As you'll notice, the SBI began trending downward in March of 2007, before the downturn in 2008, while the national employment numbers did not start declining until after the recession start. These both have a trough, but the SBI downturn begins much sooner.
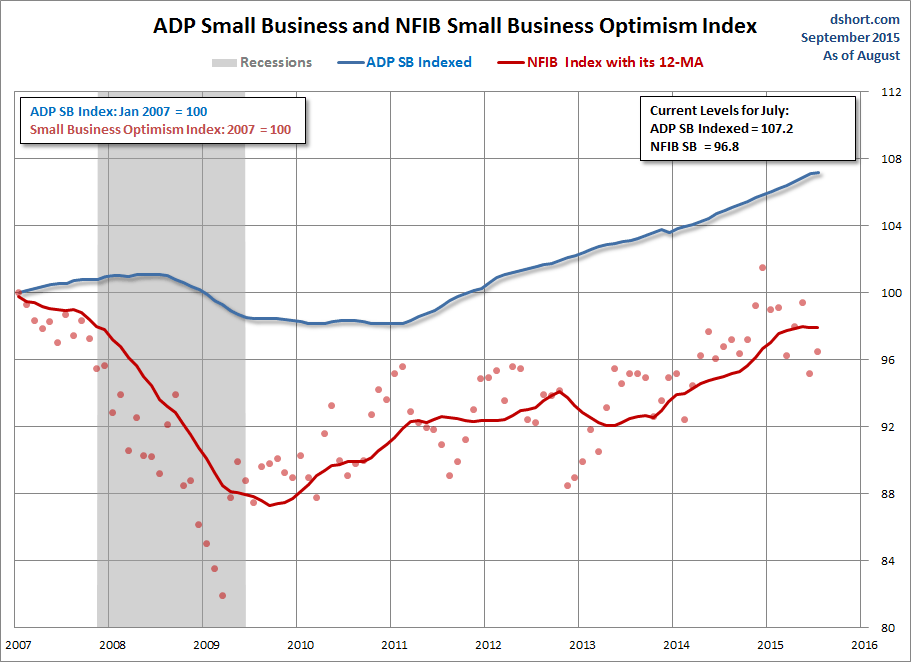
For comparison, let’s look at the ADP Small Business Report, which measures private sector business employment using client payroll data and is a subset of the ADP National Employment Report. The primary difference between the SBI and ADP are the categorizations of small businesses. ADP includes in their index small businesses such as singular franchise stores that are part of a larger business, whereas the SBI uses only independent business with less than 20 employees. The ADP index tends to be more optimistic than SBI due to this fact.
Here is the ADP Small Business Report along with NFIB Small Business Optimism Index and its 12 month MA. The NFIB Research Foundation collects data on small businesses and calculates an Optimism Index to gauge small business sentiment with data going back to 1986 using surveys. We have indexed both the ADP and NFIB to January 2007 = 100 for comparison to the Intuit Small Business Index. Note that the latest ADP and NFIB data are released after the SBI data is out. We will be updating this article again after these data are released.

The NFIB is much more volatile an indicator than the other small business indexes, most likely because it is a sentiment index - an opinion indicator - and is measured slightly differently than the other two.
