Using basic options techniques in a $100,000 Portfolio, we're going to aim for making 5-10 trades per month that will make a $5,000 net profit each month. These will be, for the most part, short-term trade ideas that we will track in a virtual portfolio that will be replacing the $25,000 portfolio at PSW.
Why $100,000? Because, in general, we'll be trading blocks of 10 contracts and that means the trades can be scaled down for smaller portfolios and also because there will be day trading and margin trading that is not appropriate for smaller portfolios. I will do my best to discuss the implications for smaller portfolios but, as a rule of thumb, If we are trading less than 10 contracts in the 5% Portfolio, then it is NOT APPROPRIATE for a smaller portfolio.
Also, there will be trades that are longer-term, though our focus will be to look for in and out opportunities, staying cashy and flexible as much as possible so we can take advantage of opportunities as they come along.
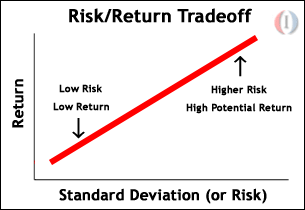
Keep in mind these are going to be aggressive, high-risk, high-reward trade ideas and should only be played with GAMBLING MONEY that you can afford to lose. For the bulk of our stock allocations, we prefer long-term, "BE THE HOUSE – Not the Gambler"-style trading, where we SELL premium to give ourselves a statistical advantage in our trades.
In our Long-Term Portfolio, our goal is to make steady 15-20% annual returns while our Short-Term Portfolio is more aggressive and opportunistic, with the mission of also protecting the bullish Long-Term Portfolio with bearish hedges. The 5% Portfolio will be self-contained and the key to making money with aggressive trades is sound risk-management. By means of example, let's look at the June trade ideas that were published on Seeking Alpha and how they would have played out for this portfolio:
On June 17th we picked up the Nikkei ETF (NYSE:EWJ) July $14 puts for 0.90. For the purposes of this portfolio, we tray to make $1,000 on each trade so 20 puts for $1,800 would have been appropriate, hoping for a 50% gain and stopping out with a 50% loss. A put is an option where you pay for the right to sell the underlying stock or ETF at the strike price. You "win" if the stock is below the strike you selected and "lose" if it's above it. That's it – it's that simple.
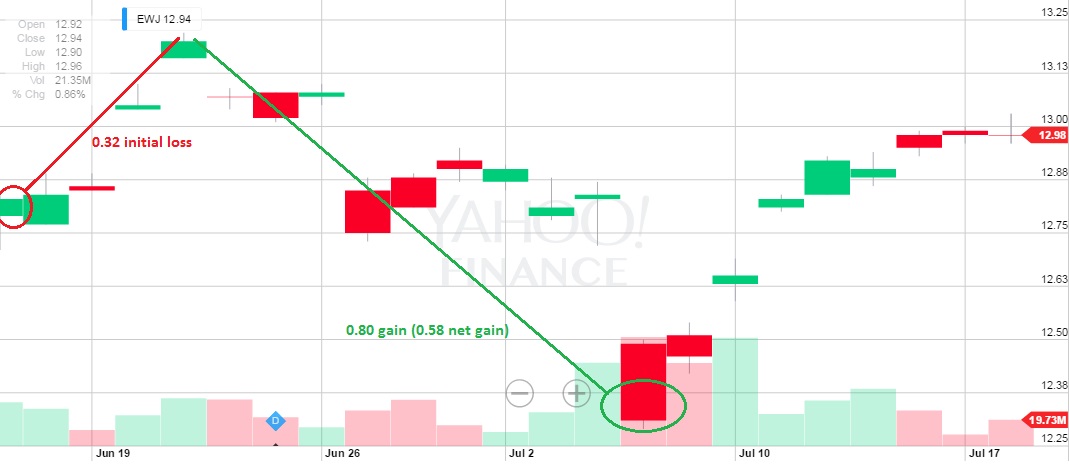
At first the position went the wrong way and the puts had a delta of 0.80, which means they lost 80 cents for each dollar EWJ moved against them. IN this case, EWJ went from $12.80 to $13.20, a gain of 0.40 and the puts dropped 0.32 to 0.68, still well above our 0.45 stop line. Then things went our way and EWJ dropped to $12.30 and topped out over our $1.35 (+50%) goal.
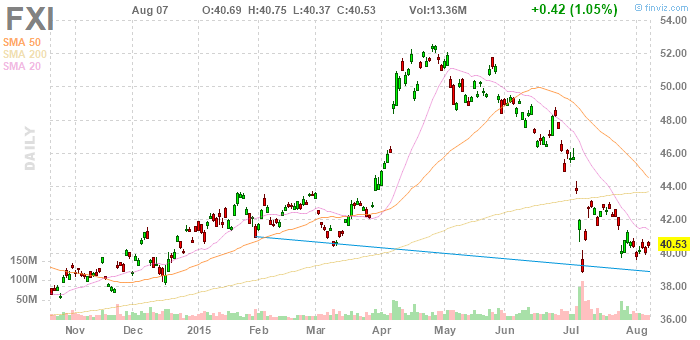
That's it, it's that simple. Just 3 weeks to a 50% gain on that trade. In that same post, we had also discussed our short on the China ETF (ARCA:FXI) trade, where we had been shorting since it crossed the $50 line, you could have played the stock and made 20% on that one and our options (June $50 puts) were already up 158% ($3.10) from our $1.20 entry on 5/11.
Notice in our posts we lay our our investing premise going over the entire global macro – these are not just quick stock picks with no explanation. This helps us see if our premise is holding up or not as the trade progresses over time.
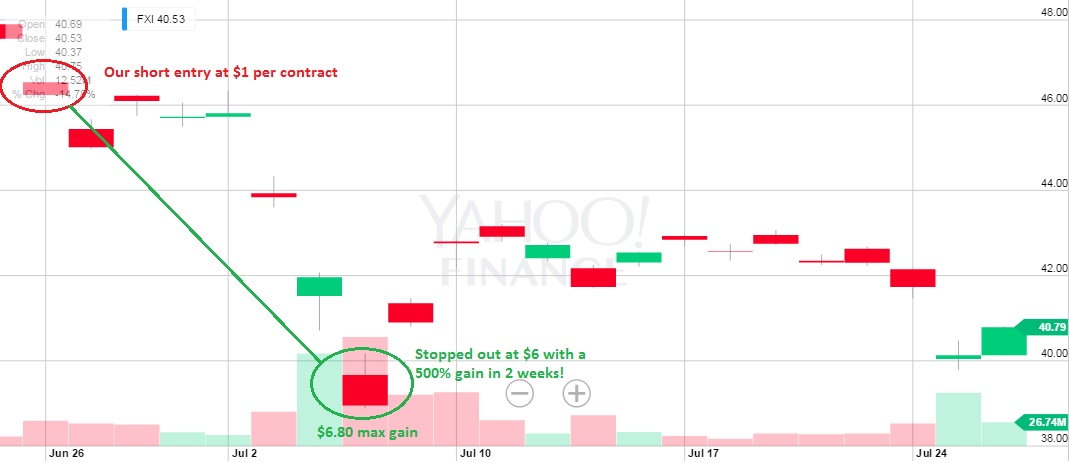
We're never ashamed to go back to the well again when it's producing water and, on June 26th we still like China short, going with the China ETF (FXI) Aug $45.50 puts at $1. As with EWJ, the appropriate size would have been 20 contracts for $2,000 (2% of our portfolio in allocation) and, as you can see, this one didn't give us any trouble at all as the puts were over $6 (up 500%) less than two weeks later. That turned $1,000 into $6,000 for a $5,000 – our goal for the whole month!
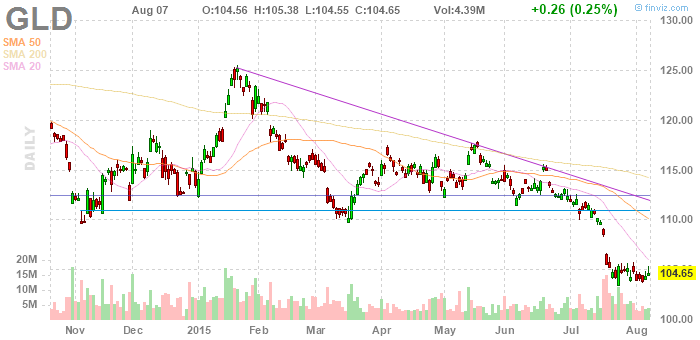
On June 29th, we shared another trade idea. This time it was a long on the Gold ETF (ARCA:GLD), which had fallen to $112.50 and we decided to call a bottom and pick up the GLD July $111.50/112.50 bull call spread at 0.50 and the appropriate allocation would have been 40 contracts for $2,000, hoping for a $1,000 gain.
That one was an epic failure and GLD failed to hold $112.50 and then failed $111.50 and, for the purposes of this portfolio, we would have had to stop out with a $1,000 loss along the way. Gluttons for punishment, we still like GLD long here ($104.65) and, if you want a free sample of a trade going forward, our play would be:
- Buy 20 GLD Sept $104 calls for $2.50.
- Sell 20 GLD Sept $106 calls for $1.50
The net cost of that spread is $1, which is $2,000 for 20 option contracts. The net delta on the spread (the amount the price of the spread should change for each $1 move in GLD) is 0.15, so we KNOW that we will lose 0.45 if GLD drops $3 and that make our stop out line roughly $102. We make our maximum profit ($2,000) if GLD is simply over $106 on September expiration day (18th) but, if we make a quick 50% ($1,000), we are very likely to take the money and run.
There, that's how simple these trade set-ups are going to be. We will have an entry point and an exit point and we will know why we are in a trade and we will know when and where to get out of a trade to control our losses (if any).
While we have dozens of trade ideas at PSW each month, these were just 3 that we shared for free in our morning posts at Seeking Alpha and the final score was +$1,000, +$5,000 and -$1,000 and PRESTO!, we hit our 5% goal for the month. In this portfolio, you can expect 1-2 trade ideas each week but we won't be forcing them – primarily we try to follow Warren Buffett's Rule #1 which is "Don't lose money!" If we don't see a trade that we are 80% sure about, we won't call it.
Even when we're 80% sure we're still wrong 60% of the time but that ends up giving us a 40% advantage. If you imagine that with $1,500 average gains and $750 average losses, then it would be +$9,000 and -$3,000 for a $6,000 monthly average. The key is CONTROLLING THOSE LOSSES and we will talk a lot about position and portfolio management as this series continues.
I hope you'll join us and our tracking portfolio with our first GLD trade idea in it will be updated 1-2 times a month as well, so you'll always know where we stand:

We look forward to an exciting year and remember, each month we have the same goal, you can come in and out any time you need some fresh trade ideas and, of course, we'll be looking to educate you on option strategies along the way as well.

