This week, I looked at that the ETFs for the six largest European countries. While all have rallied from earlier-in-the-year lows, none indicate a strong underlying economy. I found this odd. Although the EU is certainly not in the economic fast lane, the underlying data doesn’t support these low valuation levels.
Topline Growth is Moderate But Consistent
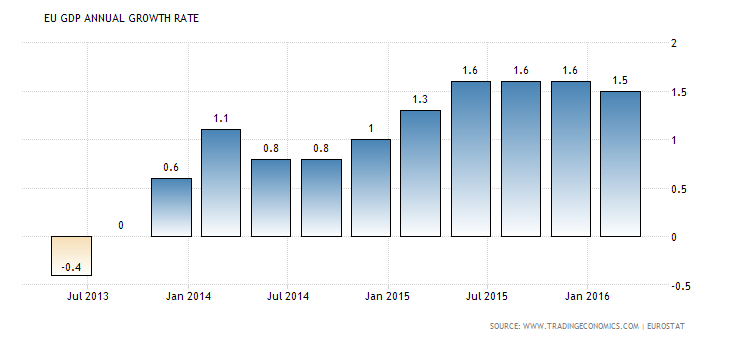
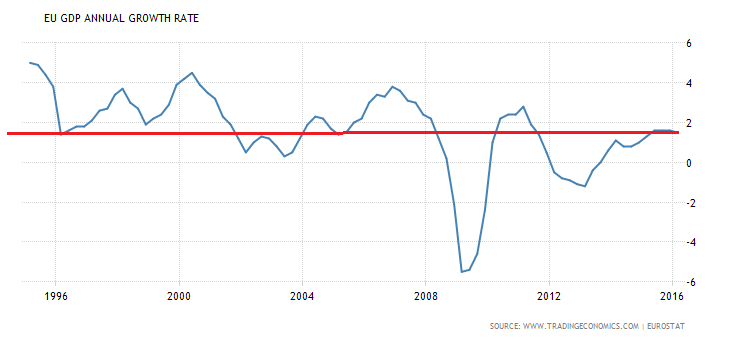
The top chart shows the region grew for the last 10 consecutive quarters with the pace of growth increasing from .6% in 1Q14 to the last 4 readings of between 1.5% and 1.6%. The bottom chart places these numbers into historical perspective. Growth was clearly stronger in the 1990s. But the region experienced similar growth rates in the first have of the ’01-’07 expansion, placing current GDP readings at approximately the average of the previous expansion’s growth rates.
Rising Incomes Are Supporting Strong Retail Sales Increases
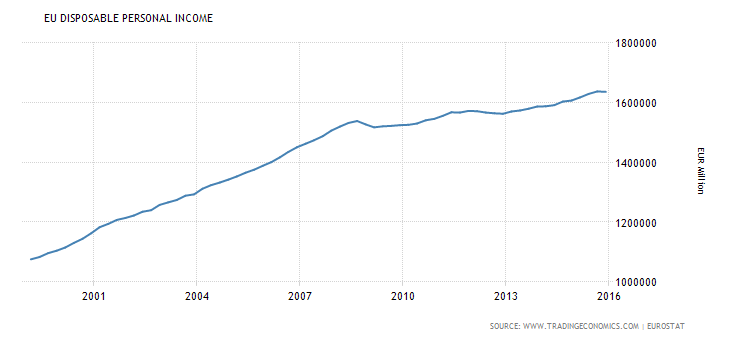
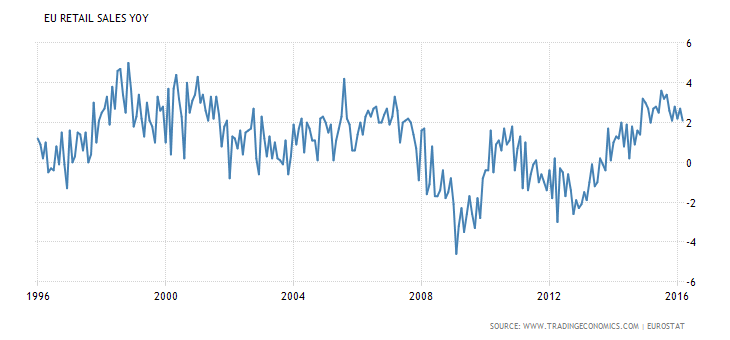
While the pace of increases in disposable income has decreased (top chart), it is still moving higher. According to the marginal propensity to consume, rising incomes leads to increased spending. This is illustrated in the bottom chart, which shows the Y/Y change in retail sales. The current pace is one of the strongest rates in the last 20 years.
Business is Slowly Expanding
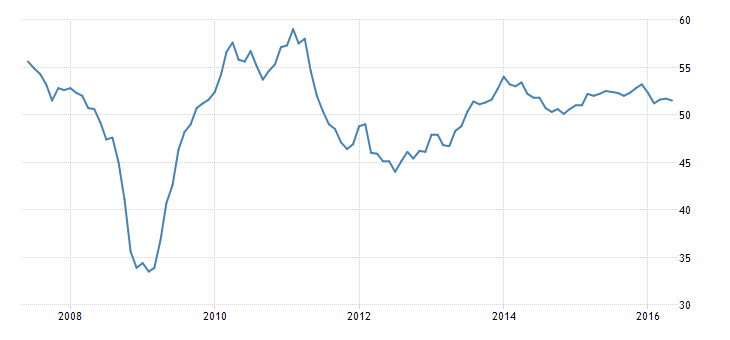
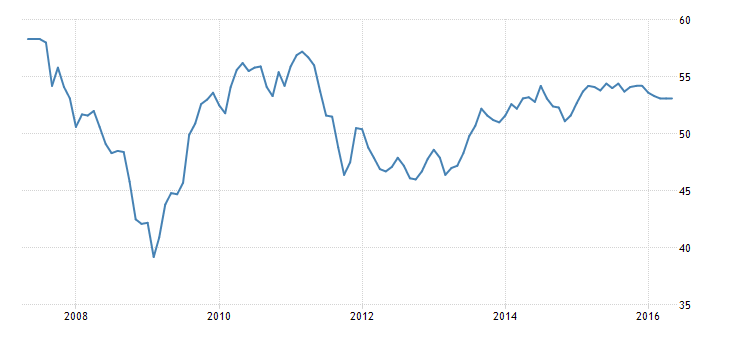
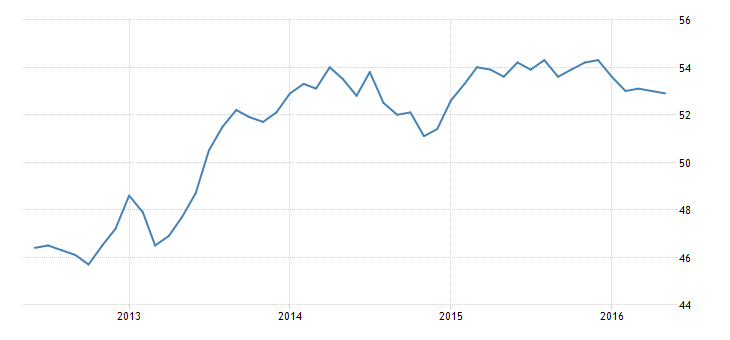
Above are three charts from Markit, where a reading above 50 indicates expansion. The top chart shows the manufacturing PMI while the middle is for the service PMI. Both have been expanding at a moderate rate since the end of 2013. The composite reading (bottom chart) has been expanding since mid-2013. All three all consistent with moderate expansion.
Trade is a Plus
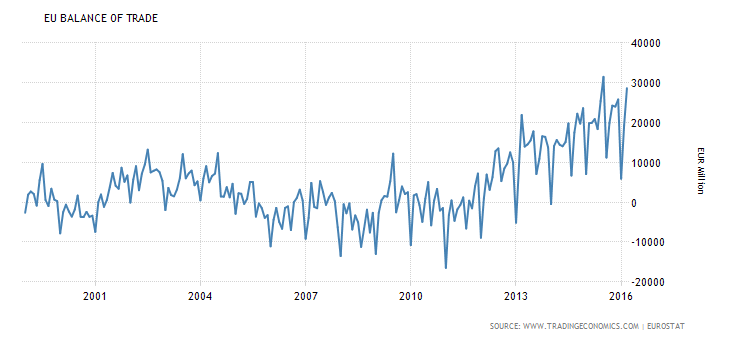
The above graph shows the EUs total trade balance since 2001. Not only is the balance positive, but it is near a 16-year high. While a weak international environment is a current drag on export growth, the positive trade balance is a clear net plus.
Capacity Utilization May Be High Enough to Warrant an Increase in Capital Investment
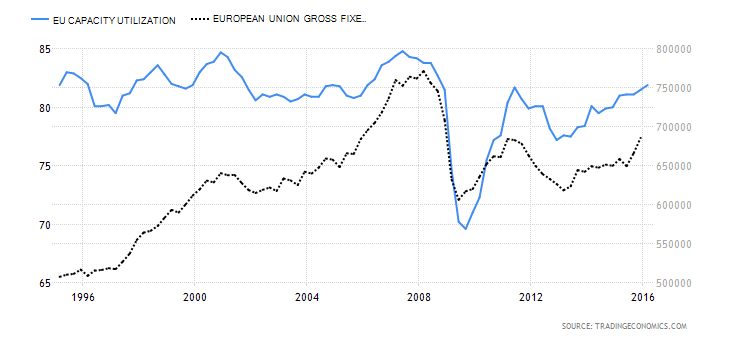
From 1996-2008, EU capacity utilization fluctuated between 80%-85%, which corresponded with a continual increase in fixed asset investment. But after the 2008 recession, capacity utilization dropped to ~70% causing a decrease in investment. Now utilization is near 80%, the Markit PMI has expanded for a little over 2 years and the trade surplus is high. The combination of these may lead to an increase in capital investment.
Industrial Production and Employment Are Large Problems
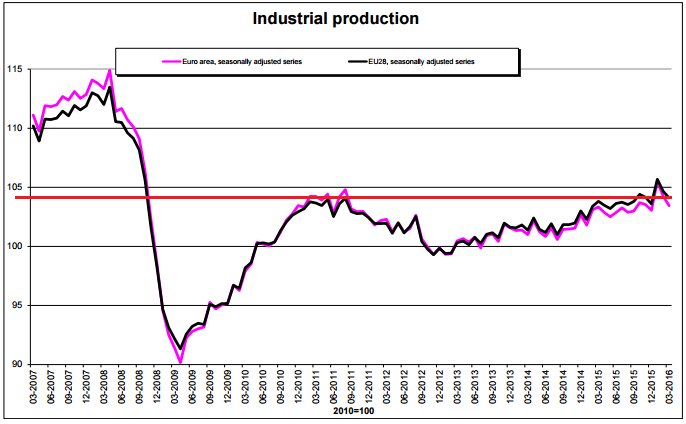
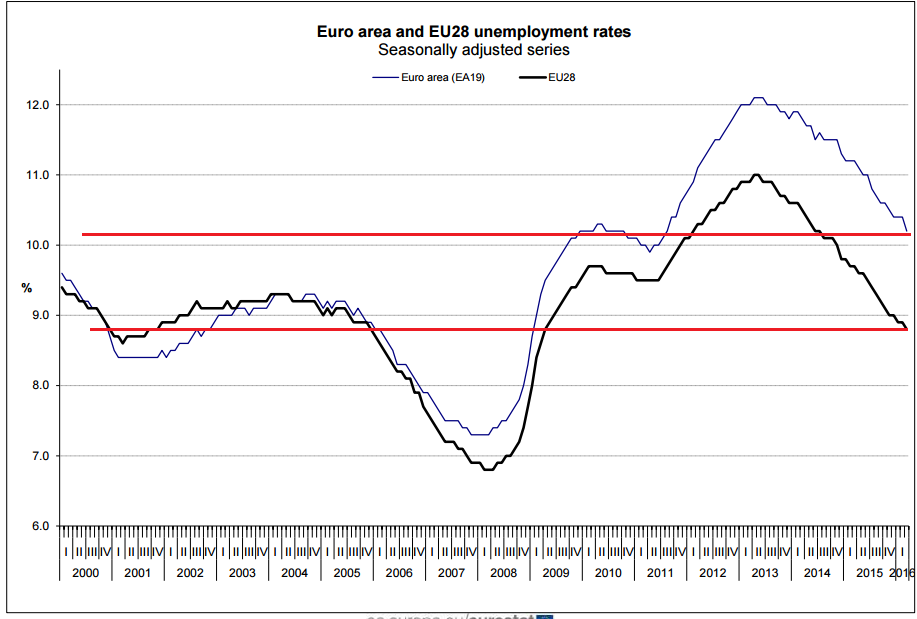
The top chart shows industrial production remains far below re-recession levels. The bottom chart shows that unemployment for both the EU19 and EU28 is still between 2% and 2.5% above the best levels of the last 15 years.
Conclusion: the EU Is Growing Weakly
The most important above figure is the strong Y/Y growth in retail sales, which is at levels from the 1990s. For an advanced economy dominated by consumer expenditures, this is a key figure. Business’ overall condition is fair; the PMI numbers indicator it is growing moderately. But a weak international environment is clearly containing growth. But overall, the EU is not nearly as bad as reported.
