
Interactive Brokers Group, Inc.’s (NYSE:IBKR) second-quarter 2019 earnings per share of 43 cents lagged the Zacks Consensus Estimate of 48 cents. Moreover, the figure compared unfavorably with the prior-year quarter’s earnings of 57 cents.
Results were hurt by a decline in revenues along with higher expenses. However, the Electronic Brokerage segment’s performance remained decent in the quarter. Moreover, the company witnessed year-over-year rise in daily average revenue trades (DARTs).
Interactive Brokers reported comprehensive income available to common shareholders of $36 million or 46 cents per share compared with $28 million or 39 cents per share recorded in the prior-year quarter.
Revenues Decline, Expenses Rise
Total net revenues for the reported quarter were $413 million, down 7.2% year over year. The decline was due to a fall in commissions and trading gains along with rise in interest expenses. The company reported other losses of $30 million in the quarter. The top line lagged the Zacks Consensus Estimate of $509 million.
Total non-interest expenses increased 8% from the year-ago quarter to $188 million. Rise in all expense components except for execution, clearing and distribution fees, and communications costs were the reasons behind this increase.
Income before income taxes was $225 million, down from $271 million in the prior-year quarter. Pre-tax profit margin was 54%, down from 61% a year ago.
Quarterly Segmental Performance
Electronic Brokerage: Net revenues increased 6.8% year over year to $473 million. Pre-tax income rose 6.7% to $302 million. Total DARTs for cleared and execution-only customers were 828,000, up 4% from the year-ago quarter. Pre-tax profit margin remained unchanged at 64%.
Market Making: Net revenues were $20 million, down 9.1% from the prior-year quarter. Pre-tax income was $11 million, up 22.2% year over year. Pre-tax profit margin was 55% compared with 41% in the year-ago quarter.
The Corporate segment reported negative revenues of $80 million compared with $20 million in the year-ago quarter. Pre-tax loss was $88 million compared with loss of $21 million a year ago.
Strong Capital Position
As of Jun 30, 2019, cash and cash equivalents (including cash and securities set aside for regulatory purposes) totaled $32.3 billion compared with $25.7 billion as of Dec 31, 2018. As of Jun 30, 2019, total assets were $66 billion compared with $60.5 billion as of Dec 31, 2018. Total equity was $7.6 billion compared with $7.2 billion at the end of December 2018.
Our Take
Interactive Brokers is poised to capitalize on growth prospects, backed by its market-leading position, technological advancement and optimization of resource allocation across global electronic networks. However, higher expenses witnessed in the quarter remain a concern. Moreover, expectations of rate cut make us apprehensive about the company’s prospects.
Interactive Brokers Group, Inc. Price, Consensus and EPS Surprise
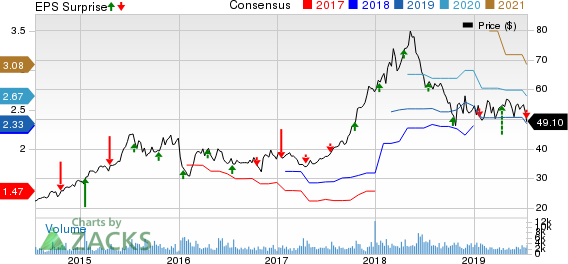
Interactive Brokers Group, Inc. price-consensus-eps-surprise-chart | Interactive Brokers Group, Inc. Quote
Currently, Interactive Brokers carries a Zacks Rank #4 (Sell).
You can see the complete list of today’s Zacks #1 Rank (Strong Buy) stocks here.
Performance and Upcoming Releases of Other Companies
Charles Schwab’s (NYSE:SCHW) second-quarter 2019 earnings of 66 cents per share were in line with the Zacks Consensus Estimate. Also, the bottom line rose 10% from the prior-year quarter. Revenue growth (driven by rise in interest income) and an increase in total client assets aided the results.
TD Ameritrade Holding Corp. (NASDAQ:AMTD) is slated to announce results on Jul 22, while T. Rowe Price Group, Inc. (NASDAQ:TROW) is expected to release results on Jul 24.
(We are reissuing this article to correct a mistake. The original article, issued on July 17, 2019, should no longer be relied upon.)
The Charles Schwab Corporation (SCHW): Free Stock Analysis Report
TD Ameritrade Holding Corporation (AMTD): Free Stock Analysis Report
Interactive Brokers Group, Inc. (IBKR): Free Stock Analysis Report
T. Rowe Price Group, Inc. (TROW): Free Stock Analysis Report
Original post
Zacks Investment Research