Get 40% Off
🚀 AI-picked stocks soar in May. PRFT is +55%—in just 16 days! Don’t miss June’s top picks.Unlock full list

Interactive Brokers Group Traces A Bearish Harmonic

Published 04/09/2014, 01:53 AM
Updated 05/14/2017, 06:45 AM
ETFC
-
SCHW
-
IBKR
-

My assessment is purely based on the price action on the weekly charts. Take a look.

The chart for E-TRADE Financial Corporation (NASDAQ:ETFC), although it has a cool symbol in its name is pulling back from a top 3 weeks ago. The current week may print a doji, signalling indecision, if the current action keeps up, but the Relative Strength Index (RSI) is falling at the mid line and the MACD has crossed down. With the 38.2% retracement of the move higher still far below, it needs to prove it wants to change direction.
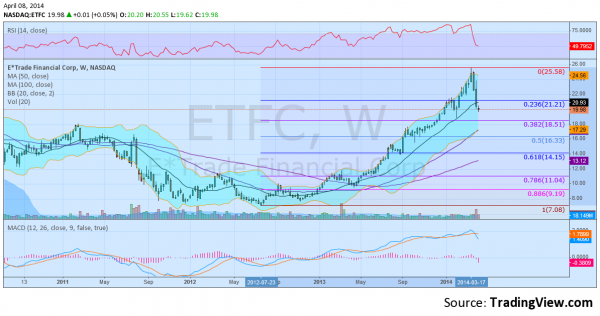
ETFC Daily Chart

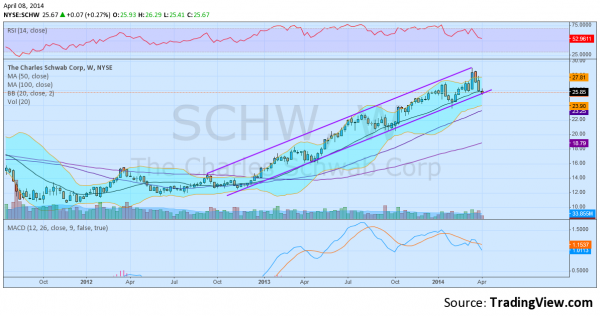
The Charles Schwab Corporation (NYSE:SCHW), is in the same boat. Testing the bottom of a rising channel, but with the RSI making a lower low and the MACD crossed down and continuing to fall. You could try it long here on a tight stop around 25.25 looking for a bounce at the channel, but again, I would prefer some proof or a reversal.

SCHW Daily Chart

Interactive Brokers Group Inc (IBKR.O), chart is a stark contrast. Having pulled back and made a double bottom, the price action is actually tracing out a bearish Shark harmonic, but with a Potential Reversal Zone (PRZ) above at 24.52. The RSI has found a bottom and is rising and the MACD is leveling after the pullback. If you want a brokerage stock, Interactive Brokers should be the one. Maybe they will give me some free trades for this? 
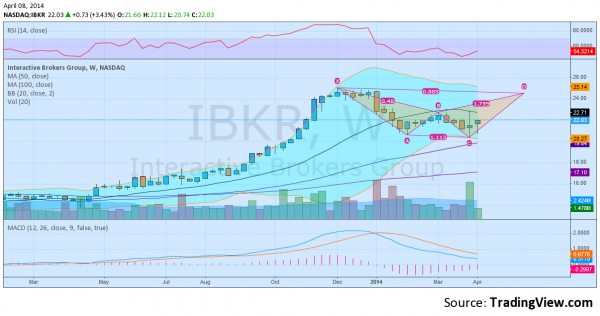
IBKR Daily Chart

Disclaimer: The information in this blog post represents my own opinions and does not contain a recommendation for any particular security or investment. I or my affiliates may hold positions or other interests in securities mentioned in the Blog, please see my Disclaimer page for my full disclaimer.

Original post

Latest comments

Loading next article…
Risk Disclosure: Trading in financial instruments and/or cryptocurrencies involves high risks including the risk of losing some, or all, of your investment amount, and may not be suitable for all investors. Prices of cryptocurrencies are extremely volatile and may be affected by external factors such as financial, regulatory or political events. Trading on margin increases the financial risks.
Before deciding to trade in financial instrument or cryptocurrencies you should be fully informed of the risks and costs associated with trading the financial markets, carefully consider your investment objectives, level of experience, and risk appetite, and seek professional advice where needed.
Fusion Media would like to remind you that the data contained in this website is not necessarily real-time nor accurate. The data and prices on the website are not necessarily provided by any market or exchange, but may be provided by market makers, and so prices may not be accurate and may differ from the actual price at any given market, meaning prices are indicative and not appropriate for trading purposes. Fusion Media and any provider of the data contained in this website will not accept liability for any loss or damage as a result of your trading, or your reliance on the information contained within this website.
It is prohibited to use, store, reproduce, display, modify, transmit or distribute the data contained in this website without the explicit prior written permission of Fusion Media and/or the data provider. All intellectual property rights are reserved by the providers and/or the exchange providing the data contained in this website.
Fusion Media may be compensated by the advertisers that appear on the website, based on your interaction with the advertisements or advertisers.
© 2007-2024 - Fusion Media Limited. All Rights Reserved.