
Oil mounted a strong surge last Thursday as Saudi Arabia-led forces carried out a series of airstrikes against Houthi militants in Yemen, part of which is bordered by the Bab el-Mandeb strait, an important shipping “chokepoint.” For the first time in three weeks, Brent oil prices rose to $59 while West Texas Intermediate (WTI) crude closed above $51 after an incredible seven-day rally.
However, the conflict wasn’t enough to sustain the uptrend, and prices slipped yesterday—WTI to $48.41.
“The significance of the conflict was overblown, at least in terms of its effect on oil,” says Brian Hicks, portfolio manager of our Global Resources Fund. “There’s still too much supply.”
Indeed, U.S. crude oil supply is noticeably on the rise. As you can see in the chart below, the weekly crude reserves are significantly above the five-year average and sharply headed higher. 
Last week we learned that storage at Cushing, Oklahoma, reached 54.4 million barrels, a new high. Cushing is important to monitor because it’s the nation’s largest storage facility and serves as the pricing point for WTI. Since it was upgraded in 2011, maximum capacity now stands at 85 million barrels.
But if the current fill rate keeps up—2.12 million barrels a week—the cap could be reached as soon as this June, however unlikely that seems. Vehicle sales are up, as is the number of miles being driven on U.S. highways, and the busy summer travel season is fast approaching.
American Innovation to Thank
Simply put, technological advances such as hydraulic fracturing, or fracking, have made the oil-extraction process much more efficient than anything we’ve seen before. Amazingly, output continues to climb even as the number of rigs in operation has dropped for the fifteenth week. 
“Productivity is up 50 percent over the last five years,” Brian says. “There’s already been some slowdown, but we’re still seeing the strong momentum from last year.”
That momentum could be enough to propel us toward 10 million barrels a day, something we haven’t seen in this country since 1970.
This incredible rise in efficiency has led some analysts to foresee a possible “storage crisis” in North America. It’s possible—though, again, unlikely—that we’ll eventually reach a point when there just isn’t any more commercial storage space. “Crisis” is certainly a loaded word, but such an event could serve as the catalyst that forces companies to make meaningful production cuts, which would help oil prices recover.
In the meantime, energy storage and transportation companies such as Kinder Morgan (NYSE:KMI) and Tsakos Energy Navigation (NYSE:TNP) are profiting in a world of abundant oil. Tsakos recently saw strong trading after it announced a dividend, and last week Morgan Stanley) gave the company a “buy” rating.
Another area that’s benefited in this climate is the plastic packaging and container industry. Since oil prices began to go off the cliff last summer, returns for Graphic Packaging have climbed more than 20 percent; Sealed Air (NYSE:SEE), 39 percent; and Berry Plastics, 42 percent.
Demand Not Dissipating
At the same time that fracking has pushed daily U.S. oil output to 32-year highs, improvements to our vehicles’ internal combustion engines have increased the number of miles we can drive on a tank of gas to all-time highs. 
Requiring less fuel to get farther doesn’t mean demand is slipping. Quite the opposite, actually. Car and truck sales are expected to climb for the sixth straight year in 2015, a winning streak we haven’t seen in over 50 years. 
Automobile pricing and information website TrueCar predicts that 17 million light-weight vehicles will be driven off car lots by the end of 2015, a 10-year high.
Since 2009—when sales plummeted to roughly 10 million units, their most depressed state since 1982—year-over-year sales growth has surged as the U.S. has pulled itself out of the recession. In each of the past 12 months, 200,000 or more new jobs were made available to Americans, the most since 1977.
Americans are not only buying more vehicles—some as new additions, others to replace aging clunkers—but they’re also taking them on the road more, especially now that national average fuel prices have fallen more than 31 percent from a year ago.
In fact, Americans drove a record 3.05 trillion miles on U.S. highways in January for the 12-month period, breaking the previous record set in November 2007. And with the busy summer travel season ahead of us, we should expect to see this number rise even more. 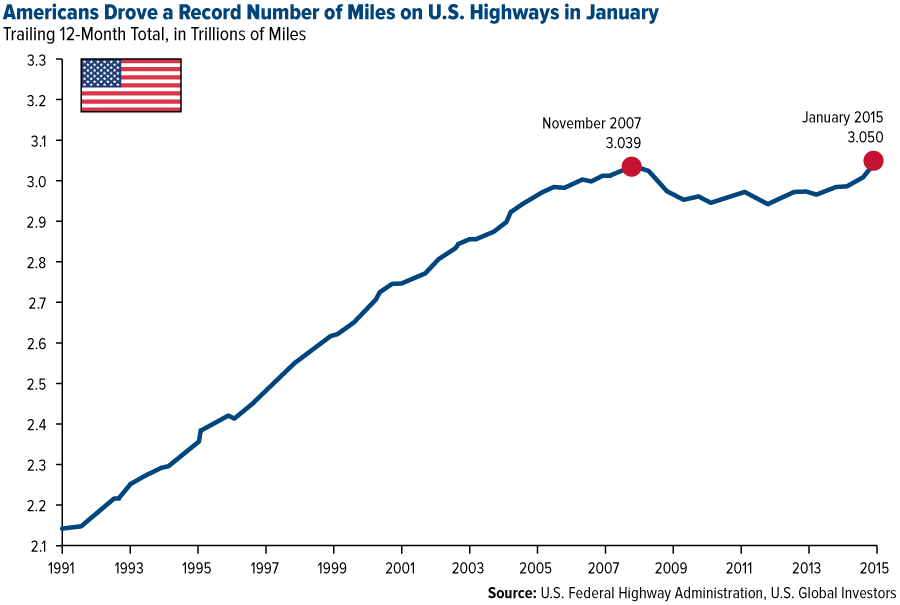
Three trillion miles, by the way, is equivalent to taking more than 200 round trips to Pluto.
That’s a lot of fuel being consumed—even if our vehicles are more fuel-efficient.
According to the Energy Information Administration (EIA), gas consumption in 2015 will rise 1 percent over the previous year to reach 9 million barrels a day—a little under the number of barrels of oil the U.S. now produces daily.
Add to that the fuel consumption coming from U.S. airlines, which are also working on improving fuel-efficiency. As I pointed out earlier this month, the number of miles flown on both domestic and international carriers is flying higher, along with the number of seats per flight.
Disclosure and Disclaimer: Foreign and emerging market investing involves special risks such as currency fluctuation and less public disclosure, as well as economic and political risk. Because the Global Resources Fund concentrates its investments in specific industries, the fund may be subject to greater risks and fluctuations than a portfolio representing a broader range of industries.
Fund portfolios are actively managed, and holdings may change daily. Holdings are reported as of the most recent quarter-end. Holdings in the Global Resources Fund as a percentage of net assets as of 12/31/2014: Kinder Morgan, Inc. 0.00%, Tsakos Energy Navigation Ltd 0.00%, Graphic Packaging Holding Co. 0.00%, Sealed Air Corp. 0.0%, Berry Plastics Group, Inc. 0.0%,
There is no guarantee that the issuers of any securities will declare dividends in the future or that, if declared, will remain at current levels or increase over time.
All opinions expressed and data provided are subject to change without notice. Some of these opinions may not be appropriate to every investor. By clicking the link(s) above, you will be directed to a third-party website(s). U.S. Global Investors does not endorse all information supplied by this/these website(s) and is not responsible for its/their content.